Showing posts with label polling. Show all posts

30 September 2011

More numbers #nlpoli #nlvotes

The results of this poll by the pollster for the provincial government’s energy corporation show numbers well within the margin of error for the poll and as such, don’t reliably show any change at all from the results the company released in the first week of the campaign.

The Tories lead with 44%, a change of 2% of last week. The NDP are at 27% up from 23%. The Liberals are at 11% 13% * down from 16% with undecideds at 18% down from 20%.

The margin of error for the poll remains ridiculously high at 4.6%.

Don’t expect the conventional media to report the connections between the pollster and Nalcor,  nor should anyone to report accurately on the figures and what they mean.

Instead, they’ll take the misleading approach favoured by CRA and MQO, pollsters for the provincial government and its energy corporation, and ones that fit a narrative they created before the campaign started.

- srbp -

*Copying error: 13% is the figure in the MQO news release as the percentage of decided respondents who chose Liberal. 

20 September 2011

New Poll. New Result #nlpoli

Quick.

Where’s Kathy Dunderdale today?

A new poll by advertising agency M5’s opinion research firm will give you a clue.

The poll replicates the actual numbers for CRA’s August omnibus when both are adjusted to remove the distortion of reporting voter choice as a percentage od decideds.

The MarketQuest Omnifacts poll showed the provincial Conservatives with 42% of respondents, the New Democrats at 23% and the Liberals at 145 with the undecideds at 20%.

The margin of error was plus or minus 4.9%, 19 times out of 20.

The CRA corrected numbers were 40 Tory, 18 Dipper,  and 16 Grit with 26% undecided.

Run that through the Amazing SRBP Vote-a-matic and you get a possible seat result of:

  • PC:  38
  • Libs: 4 to 7
  • NDP:  3 to 6

So contrary to what Kathy “New Energy” Dunderdale said on Day One of the campaign, the polling shows the Tories will lose seats.  The question is more one of where they’ll lose them and to whom.

if you want an idea, consider that on the basic math of it the Tories have gone from 70% of votes cast to 53% of decided voters.  Bear with this for a second and switch back to using the numbers everyone else is using.

That’s a drop of 17 points since the last general election.

If you look at the seats the Tories won by a margin of 17% or less in 2007, this is what you get:

  • Lake Melville
  • Bellevue
  • Labrador West
  • Bay of Islands
  • Torngat Mountains
  • Humber Valley
  • Isles of Notre Dame

On the face of that list right now, your humble e-scribbler would add an extra New Democrat in Labrador West to a future House of Assembly with the other seats being ones where the Liberals are historically strong and would likely pick up.

That would give you 10 Liberal seats total and that’s outside the Vote-a-matic forecast range. Just remember that this is a highly inexact subject.  What you can take away from it are places to look for further signs or information. And after all, when the poll results have a variation of five percent give or take, you are really not dealing with scalpel-like precision anyways.

For those who want to quibble, too, that this result would show the Liberals gaining more seats with fewer votes than the New Democrats, you need to appreciate that this set of observations on seats is based on taking polling and applying it against history, against what happened before.

Add to that the concept of vote efficiency and how it works in the current system.

The best example to use is the 1989 general election.  The Tories got more votes, but the Liberals took 34 seats on election night.  The Tories, for example, tend to show very well in polls.  They rack up tons of support in districts in St. John’s but once they’ve gotten enough votes to win the seat every one after that is a waste.

Well, it’s a waste from the standpoint that they didn’t need it to win.

Meanwhile over in another district – most likely off the northeast Avalon – the Tories are starving for votes.  The Liberal vote is distributed such that lots of votes don’t get wasted racking up margins beyond what you need to win.

Same thing applies, essentially, for the NDP.  They’ve got a couple or three pockets of strong support. It’s been enough to win two seats, historically.  And that’s about it.

Historically, you’d translate those polling numbers out and get a result in which the Tories could drop seven seats to the other two parties.

You likely won’t see this from the conventional media, but then again, the conventional media can’t get much beyond the superficial horse-race commentary.

All you can do, dear reader, is take it all in,  weigh it out and make up your own mind.

Oh yes. 

And notice where Kathy Dunderdale is today.

Labrador.

- srbp -

08 June 2011

The perils of polling stories

Not surprisingly, local media reports of Corporate Research Associates’ most recent quarterly poll got the news spectacularly wrong.

For example, the Telegram reported that “[s]upport for the provincial Conservatives has dropped to 57 per cent of those polled…”.

That’s not true.  The CRA release tells you that 57% of decided respondents to their poll felt that way.  There’s a difference between the people they polled and the people who they polled who made a choice about which party they’d support.

Meanwhile, CBC correctly described the party support numbers as being about decided respondents but for some reason they felt the need to add these gratuitous and unfounded editorial interpretations into their story:

The poll suggests the NDP could pose a considerable challenge to the Liberals in the Opposition benches, as the Oct. 11 general election draws closer.

Voters remain comparatively cool to Liberal Leader Yvonne Jones, who had an approval rating of 16 per cent, down from 18 per cent in March.

NDP Leader Lorraine Michael, by contrast, saw her approval jump from five per cent to 14 per cent.

So how does this happen? 

Well, for starters, CRA reports numbers as a share of decided responses, not all responses.    CRA doesn’t  explain what that means and reporters and editors typically wouldn’t know if it was fit to eat.  As a result the reports go off into the trees.  Not their fault, by the way.  The obligation is on CRA to accurately present its own information and ensure people know what it means.

Professional pollsters in the Untied States specifically reject this approach because it creates a false impression of what the poll found.  Not only does it artificially inflate some results, it actually discounts entirely a perfectly valid choice. 

People who are undecided have actually made a choice that, for the moment, doesn’t include one of the choices offered.  it’s like saying “none of the above.”

If you want to see this sort of misrepresentation in action, take a gander at the CBC report on CRA’s quarterly poll for New Brunswick.  Almost identical numbers to the ones in Newfoundland and Labrador.  Ruling Tories with a supposedly “commanding lead” of 56% and the Liberals and New Democrats in a “statistical tie” at 20% or thereabouts.

Small problem.

Look at the undecided number in New Brunswick and then look at the poll results as a share of all responses, not just “decided” voters.

Suddenly the Tories aren’t at 56%.

They are at 35%.

And the other two?  Somewhere in the low teens.

More people in New Brunswick are undecided than expressed a choice for the provincial Conservatives.  As for the opposition parties,  you’d have to use your imagination to see anything there other than a pair of parties that voters are barely noticing.

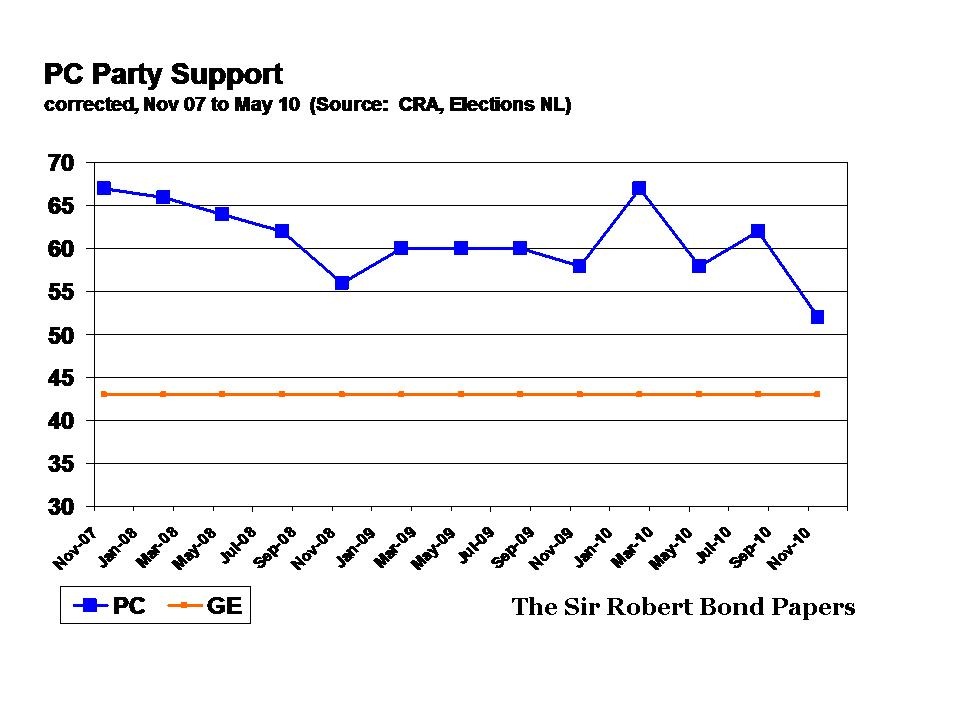
In Newfoundland and Labrador, a look at the unadulterated CRA numbers still tells you that the Tories are in front of the other parties.  You can also see a major league slide going on.  They were at 62% in August 2010, down to 51% in November, back up to 56% in February and now at 44%.

But the other parties?  As in New Brunswick, neither Yvonne nor Lorraine have captured any great attention yet.

But yes, sez you, there’s been this orange surge from eight percent up to 20%.

Yeah, not really.

For starters, the numbers are more like six percent to 15%. 

Still more than double, right?

Maybe.

Consider that the margin of error for this poll is 4.9%.  That means you can shift any number on the page up or down by five percent and still be within the range of possible numbers you’d get if you polled every eligible voter in the province.

So when you hear a reporter talk about a statistical tie or an NDP surge, odds are you have someone who learned everything they know about polls from being spun by masters of the torque.  Either that or they just read a badly distorted news release and relied on their own abilities to surmise what it means.  Doesn’t mean the reporter’s a boob:  just means the reporter doesn’t really understand what is going on.

But still, the NDP surged ahead, right?

Negative, again, there Ghost Rider.

The unadulterated CRA poll number puts the NDP at 15%, give or take five percentage points.  The Dipper machine could be at 10%, up a mere four percent from the February result. 

By the same token, they be at 19-ish%.  You can slide the Liberal or Conservative numbers up and down likewise and still be right. That’s what the margin of error means.  Plus when you consider that CRA results over the past seven years have been notoriously wide of the mark even without using the margin of error, you can pretty well bet these numbers are only vaguely close to what’s actually going on.

To give you a sense of what the results could be – take a breath for this one -  consider that at 20% of all respondents, either the Liberals or the NDP would be close to 30% of decideds in this recent survey. 

With the Tories at 44% of all respondents and 57% of decideds.

Not quite so commanding now, is it?  A pretty easy slide of another 10 percentage points, in other words, the kind of shifts we’ve already seen in the past six months, and the Tories could be looking at the shortest time in government since Confederation for any political party.

When you look at those sorts of possibilities,  it gets pretty clear to see that any  comments about the Tories having a a “commanding lead” are nothing more than total hogwash.  A relatively small shift in votes up or down for either of the parties and you’d be looking at Kathy Dunderdale potentially headed for the opposition benches come the fall.

Then there’s the second bit, namely the editorialising.  There’ll be a few New Democrats who’d love you to believe they are on the verge of a miracle here, but these numbers don’t support any such idea.  The reasons are pretty simple.

For starters, you can’t tell anything with one single point.  You need a couple of points to start making a trend. 

Beyond that, there is absolutely no sign of a gigantic shift of voter support to the NDP anywhere provincially, let alone in the metro region, despite federal electoral success over the past couple of years.  Provincial Conservatives are not happy with their Kathy but there’s a big difference between voting against Stephen Harper and voting against their local Tory candidate. 

That takes a major league piss-off of metro voters the sort you saw in the late 1980s.  St. John’s and the surrounding areas have gone anything but Tory for only about seven or eight years in the past decade.  In 1989, the Liberals took seven of eight St. John’s seats and 11 of 13 metro seats.  They did just about as good in 1993 and 1996 but after that things started to swing back toward the blue guys. Those sorts of changes don’t come easily;  it took the Tories a lot of misery after 1985 to fry townie voters to the point where they picked a bunch of red candidates in huge numbers. 

But let’s suppose for a second that we are seeing exactly what some people are claiming.  Slam the swings into the swing-o-meter and you won’t see any seats changing hands in St. John’s.  That’s because the Tories are still running so far ahead, it would take vote shifts of a magnitude out beyond what we have seen yet in order for the Tories to start sweating bullets about losing their base in town.

Come the fall you might be able to start musing about that sort of thing.  But that would be only if the NDP can somehow keep up momentum in a way they never have before, pull in way more money than they have and get tons of candidates and volunteers like they never have before.  They’d also have to run a provincial campaign using their provincial resources that rivals the federal one.  That’s a mighty tall order.

And even if the Dippers started to make some headway against the Tories in St. John’s, out beyond the overpass, the fights that will shape up would be between the Liberals and the Conservatives except in Labrador West.

Thing is voters don’t appear to be cool to Yvonne and potentially hot for Lorraine as the CBC writer imagined.  Voters haven’t warmed to either of the opposition parties and their leaders.  Lorraine’s at a amazing level of 11% while Yvonne’s at 13%. 

That could change and there’s plenty of room for change.

We just aren’t there yet.

Still, allowing for all the vagueness of these poll results, if you were Kathy Dunderdale, these poll results would be causing you a few sleepless nights in addition to the ones you are already feeling.

That’s the ongoing story in all this, just as it has been for the past six months or more.

- srbp -

07 June 2011

Dunderdale disapproval doubles; Tory vote drops to 44%

What a difference a federal election can make to provincial poll results.

According to the latest Angus-Reid poll,  43% of respondents are satisfied with Kathy Dunderdale’s performance as premier down from 55% in February and 67% for her predecessor last November.

Undecided remains at 35% of those polled.

But here’s the thing:  Those who said they were dissatisfied with Dunderdale’s performance went from 10% in February to 23%.

That trending is bad news for Danny Williams’ hand-picked replacement.

News for the Tories doesn’t get any better from Corporate Research Associates who conducted their quarterly omnibus poll from May 11 to May 28.  Margin of error for the poll is 4.9%. CRA polling seems to inflate Conservative vote in the province by anywhere up to 15 or 20 percentage points and deflate the undecided and will not vote categories by a comparable percentage.

Forty four percent (44%) of respondents said they would vote for Dunderdale’s provincial Conservatives if an election were held tomorrow. That’s down from 56% in February and 51% from last November.

“Undecided” (including refused to state and won’t vote) in the CRA poll reportedly held at 23%. It hit 31% in November just before Danny Williams announced his resignation.

So where did those ex-Tory voters go in the CRA poll?  Liberal support increased from 11% in November 2010 to 16% in the most recent poll.  The New Democrats picked up the most, going from 6% in February to 15% in May.  But here’s the thing:  before that they were hovering at 5%. 

Kathy Dunderdale and the Conservatives were already trending downward anyway.  Hitching her star to Stephen Harper didn’t seem to help the Premier’s standing with voters.  Meanwhile, the strong showing of the New Democrats in the metro St. John’s area federally seems to have been carried over in CRA’s polling.

While local media and the New Democrats will likely be torquing these results based primarily on CRA’s misleading way of reporting its research, whether the New Democrats can hang on to those numbers without help from Jack Layton remains to be seen.

What you can say is this:

  1. Kathy Dunderdale and the provincial Conservatives are in serious political trouble.  Voter support for her and her party is on the way down, continuing trends that go back about a year.
  2. At the very best, voters remain uneasy about Kathy Dunderdale. At the very worst, Angus-Reid numbers suggest there is growing opposition to her leadership. If the trending in that poll continues, Dunderdale’s satisfaction numbers will be 31% with 35% unsatisfied and another 35% unsure.
  3. At the same, voters are unsure about the opposition parties.  While the NDP seem to be having a small flourish, the numbers are nothing to write home about, especially after a prolonged period below 10%.  Meanwhile, the Liberals under Yvonne Jones have shown some modest progress over time. In CRA’s poll, both Michael and Jones are neck and neck which is pretty much where they have been for most intents and purposes for years.  Dunderdale is in a sad spot:  41% of respondents think she is the right leader for the province.

Bottom line:  People aren’t sure about Dunderdale and the Conservatives but they also aren’t sure about the other two leaders and their parties.

There’s a long time to October and any of a number of things could change the political landscape in the province dramatically one way or the other. 

- srbp -

07 March 2011

Dunderdale boosts Tory support from last Williams poll: government pollster (revised numbers) #nlpoli #cdnpoli

Corporate Research Associates issued a correction to its latest polling numbers for Newfoundland and Labrador on Monday and the result is truly startling.

The Conservatives under Kathy Dunderdale have the support of 56% of voters compared to 51% for the Tories under Danny Williams in November 2010.

Sure her personal popularity may be less than Danny’s but she’s managed to pull the Tories out of their downward slide in Danny’s last three months that took them from 61% in August to 51% in November.  Dunderdale’s started the Tories back on the path to the stars and without doing very much of anything for the past three months except fend off a weak challenge to her leadership by Brad Cabana.

Not surprisingly, the Conventional media are following along with CRA’s news release and their own conventional wisdom to make the poll numbers fit what they think the numbers should say.  They are saying that Dunderdale is not as strong as Danny but she is still pretty big.

But as absurd as it may seem, the CRA numbers really put Kathy ahead of her old patron.

According to CRA’s revised numbers, undecideds dropped from 31% to 23% in the three months or so Danny’s been gone.  The unfiltered, undistorted CRA numbers show Tory support went from 51% in November with Danny as leader to 56% with Kathy Dunderdale.

Both the change in party support for the Tories and the change in undecideds is outside the margin of error (4..9 percentage points)

“How could this be?” you are likely asking.

Call it the mother of all typos.

The original news release included this sentence:

Those with no stated preference included those who were undecided (18%), do not plan to vote (3%), or refuse to state a preference (18%).

That adds up to 39%.

The table at the end of the news release gave the figure as 23%.  Apparently that second 18% was only supposed to be two percent.

Not 18.

2.

Big difference.

It’s a bit of a head scratcher as to how someone could mistakenly type “18” instead of “2” and how the release could get out the door with such a glaring error.

Your humble e-scribbler took the figures in the text of the release in largest part since they were consistent, across the board with a similar poll done by NTV/Telelink in February.  Those are the figures used in an earlier post

Now what we are left with is a poll that mirrors Telelink in every way except in Conservative support and the level of undecided/no answer and will not votes.  The differences are hardly inconsequential. 

What this cock-up really should be is a reminder that CRA’s poll reporting does contain some rather glaring problems.  For instance, CRA routinely distorts the results of its polls by presenting only the results for decided voters. You can see the effect of that misrepresentation by charting the results as a share of all responses, not just the “decideds”. This chart is taken from post last December on CRA’s fourth quarter poll.

According to CRA’s version, the Conservative party’s support remains in the mid 70s. What doesn’t get noticed is that the “undecided” category has gone from the teens to 31% in November 2010.  Now it’s dropped again to 23% in the most recent poll.

You’ll also see in the middle of that chart another clue that something is seriously wrong with CRA’s polls.  That flat line in the middle would be a period of three consecutive quarterly polls where the difference in Tory support was apparently less than one percent. Those interested in a more detailed discussion can find it in an older post:  There’s a fairly lengthy post that discusses most of the major problems with CRA polling:  “How the Tories get 28% more votes thanks to CRA”..

For the first time in a long while, CBC has added a few questions to CRA’s quarterly polling.  Ostensibly they give new information, but essentially, CBC just gives a variation on the basic horse race questions. One of the CBC questions even repeats the same flawed question format of “mostly” and “completely” and equally extreme negative choices.  On other occasions, incidentally, CRA has asked a typical five point Likert scale (strong and moderate positives and negatives with a neutral) and reported the results as “completely” or “mostly” as appropriate. 

What is the difference, after all, between completely and mostly, compared to completely and somewhat?  think about it for a second and you’ll get the point.

What’s missing in all the questions is the sort of stuff that would give any indication of what Newfoundlanders and Labradorians are concerned about.  What pollsters typically do is ask what issues are of concern to their respondents.  Then they might ask voters to rate party performance on each question.  Sometimes they might leave out the party support questions so as not to unduly influence the responses, but with or without it, one can get a much better sense of what potential voters are thinking.

Instead of some insight, one gets absurd responses.  For example, when asked whether Williams departure will influence party choice (the question itself is oddly worded, by the way), 34% said they were less likely to vote Conservative while 30% said they are more likely. 

Huh?

Exactly.

And don’t forget the Conservatives supposedly enjoy 73% voter support  - using CRA’s own method of reporting - with only 18% actually undecided in their party choice.

And as a last point, let’s just remember this basic point.  CRA polls eligible voters.  They don’t screen for usual voters or regular voters.  They just survey all eligible voters. That means you need to compare their poll results, including UND/DK/NA with the actual poll results for any given election.

In their Fall 2007 quarterly survey, CRA put the combined no answer/will not vote/undecided at a mere 18%. The actual result on polling day was 38%.  CRA’s quarterly polls typically show that the “will not vote” category is less than five percent.

-srbp-

Tories at 44.5%, UND at 39%: government pollster #nlpoli #cdnpoli

Double-down Update:

  • CRA's issued a correction that its UND category was 23% as shown in the table not 39% shown in the text.  That's one mother of a typo and therefore that's worth a whole new post, coming later.
  • CBC apparently piggybacked on this one and has some specific questions of its own coming later on Monday evening.  That would warrant a separate post on its own.
  • New post:  “Dunderdale boosts Tory support from last Williams poll

Original Post begins...

Support for the ruling provincial Conservatives under Kathy Dunderdale is at 44.5% compared to 61% last August under Danny Williams according to a Corporate Research Associates quarterly poll released on Monday.  The results match almost exactly with a recent NTV/Telelink poll that put support for the province’s Tories at 44.3%.

Undecided, including those who refused to answer and those who do not plan to vote is at 39%, up eight percentage points from CRA’s November 2010 poll.  NTV/Telelink reported 37.9% of its respondents didn’t know how they might vote, wouldn’t state a preference or indicated they would not vote.

And that’s where the real story is for these polling numbers.  According to CRA’s polls, support for the provincial Conservatives started to slide during the last three months of Danny Williams’ leadership.  His abrupt departure didn’t stop the slide.

What’s worse, the margin of error for this poll is 4.9%.  That means there is a possible variation in those numbers of almost 10 percentage points.  Given that the Tory and UND number is less than 10% is it possible that more people are undecided or won’t state a preference than are actually indicating they will vote for the provincial Conservatives.

There are problems with the way CRA presents its figures.  For example, they show party choice for decided voters.  This is highly misleading as can be seen in the party vote numbers. The obvious decline in Tory support vanishes completely because of the way CRA reports its figures.

Still, if you look at the numbers, understand what you are seeing, and can check them against a second set of figures like NTV/Telelink, the results can be dramatically different than what you will see reported by conventional media.

These poll results from two different firms don’t  mean the Tories will lose the next general election.  What they do show is an electorate which is sufficiently uncomfortable that they will not state a clear support for the ruling party.  The fall general election could be up for grabs, depending on what the Conservatives and the opposition parties do over the next three to seven months.

- srbp -

17 January 2011

Tory angst might be well founded

Conservatives across Newfoundland and Labrador seem to be in a bit of a tizzy. Danny Williams’ sudden departure has the caucus so spooked they are trying to engineer a backroom deal to avoid a leadership contest.

On some level you have to wonder why they might be so uptight.  After all, to casual observers they would appear to be guaranteed an easy victory in October’s general election with or without the Old Man.

But then you see things like an online poll at The Western Star:  “If you were a Danny Williams supporter, are you less likely to vote PC now?”

So far, 46% of respondents are saying yes, they are less likely to vote Tory. 15% say they are more likely to vote PC and the remainder  - 39% – answered “no”.

Even in the government’s own polls, Danny always ran way ahead of the party.  In the most recent government poll, though, support for the party dropped about 10 percentage points compared to a poll done three months earlier. That wasn’t good even when people thought Danny would still be around for the fall election.

Now that he’s gone, things will likely turn out very differently.  People who barely won their seats at the peak of supposed Danny-mania in 2007 might not have such an easy time of it in 2011.  They might need a boost, like say from a cabinet appointment, to try and counteract the loss of Danny Williams’ entire coat.

Stop and think about it for a second, though, and the long term trend of Danny running in front of his party’s support and the Western Star online poll are pointing in the same direction.  It would make sense that people who had voted Conservative in the recent past would now be thinking about shifting their vote.  They were Danny Tories, as it were, not committed Tories.

All that would lead explain why Conservatives in the province are a wee bit out of sorts these days. 

And if the number of soft Tory votes is actually close to the 46% the Star found, then politics over the next eight or 10 months is going to be way more interesting than anyone suspects right now.

- srbp -

08 December 2010

Russell launches survey on Muskrat Falls proposal

Now this should cause a bit of a stir in some quarters:

Labrador M.P. Todd Russell today announced that he is conducting an opinion survey throughout Labrador, in order to gauge Labradorians’ opinion of the proposed Muskrat Falls hydro project, recently announced by the provincial government and Nalcor.

“The proposed Muskrat Falls project has been planned for decades,” Russell said. “This important Labrador resource can only be developed once. If it is to be developed at all, it has to be done right. This survey is intended to give Labradorians a collective voice before final decisions are made that will impact generations to come.”

The survey consists of twelve simple questions on various aspects of the proposed Muskrat Falls project. Survey forms have been distributed by mail to every residential address in Labrador. In certain communities, the survey forms will be distributed in bilingual Innu-aimun/English or Inuktitut/English formats.

“I appreciate that this proposed project is of great interest to people in other parts of the province and the country,” Russell said, “and I thank them for their interest.”

“As Member of Parliament for Labrador, I need a clear picture of where my constituents stand on this issue. Only those responses from people who live in Labrador, or who are eligible to vote in Labrador, will count towards the final results.”

In order to be included in the tabulation, contact information will be required. Additional demographic information may also be provided by survey respondents if they choose to do so.

Russell assured all participants in this survey that their personal information and individual responses to survey questions will be kept strictly confidential.

- srbp -

You can get the survey, online, in four languages at www.toddrussell.ca.

06 December 2010

Tory support drops sharply

Support for the province’s ruling Conservative Party dropped by about 10 percentage points in Danny Williams’ last month in office according to a poll released on Monday by the provincial government’s official pollster.

Corporate Research Associates reported that 75% of decided respondents to a survey said they would vote Conservative if an election were held tomorrow.

CRA reported that the undecided, do not know and will not vote categories amount to 31%.  In itself, that’s the largest UND reported by Corporate Research Associates in the past five years.  It’s also up dramatically from the 19 percent reported in August.

cra nov 10 correctedWhen you adjust CRA’s party support number to show as a percentage of all respondents, the Tory vote drops to 51.8% from the 61.8% reported three months earlier. The graph above gives the CRA polling results since the last provincial election, adjusted to show the responses as a percentage of all respondents.  The reddish-brown line shows the actual Conservative vote share in the last provincial election – 43% - shown as a share of eligible voters.  That’s the same basis on which CRA polls.

Don’t get overly excited by the gap between the two lines though.  It illustrates the extent to which CRA’s polling is out of whack. 

Except for a couple of odd drops or climbs (November 2008, February 2010 and August 2010), the Conservative support has been declining steadily since CRA’s first post-election poll. The drop overall has been from 67% in November 2007 to 52% three years later. There’s even a bizarro period in the middle where the party support was within fractions of a percentage point for nine months consistently.

If you accept the drops and spikes, the Tories have dropped from 67 to 52 since February 2010.

There are a few things to bear in mind when looking at CRA polling numbers.  First, it is well established that the provincial government organizes its political communications to influence the outcome of the quarterly poll.  Second, as the actual 2007 election result shows, CRA also gives poll results that are significantly different from actual election experience.  In 2007, CRA’s results show the Conservative vote to be much higher than it was on election day and radically underrepresented the “will not vote” by approximately 20 percentage points.

Even allowing for those considerations, the Tories appear to have experienced a dramatic decline in voter support in a relatively short span.  Neither the Liberals nor the New Democrats picked up the disaffected vote, apparently.

Nonetheless, this poll shows the extent to which the Conservatives were bleeding support even before Danny Williams announced his departure.  What happens in the 10 months to the next provincial election will hinge on developments over the next five to six months.

The Conservatives will pick a new leader and bring down a new budget.  They also face labour and other problems across the province.  A significant number of voters in the province look like they have decided to wait and see what happens.

Keep your eyes fixed on the February polling period.

CRA’s news release was not available on line as of 1430 hours Newfoundland Daylight Savings Time.

- srbp -

02 December 2010

Williams approval plummets: Angus Reid poll

A new poll by Angus Reid shows public approval in Newfoundland and Labrador for  Danny Williams’ performance as premier fell from 80% in February 2010 to 67% in November.

That’s an interesting detail buried in the release from Angus Reid.  Most media outlets apparently have taken the company’s news release and not looked at the attached research report.

The release lede notes that Williams topped the list of all premiers with Saskatchewan’s Brad Wall coming second. The first sentence of the analysis section states that while impressive, “the overall approval rating for Williams in Newfoundland and Labrador is now 11 points lower than it was at the end of 2009.”

- srbp -

13 September 2010

And the survey says… maybe not much, really

The Canadian Payroll Association is getting a chunk of media attention for a poll they just released.

The stories are running something like this one from CBC:

Almost 60 per cent of Canadians live paycheque to paycheque and say they'd be in financial difficulty if their paycheque were a week late.

A new survey from the Canadian Payroll Association released Monday showed some troubling signs about Canadians' personal finances.

To its credit, CPA released a detailed research report. That’s where you will find some useful information when it comes to the survey.

For one thing, there’s no indication of how CPA or its research partner selected or contacted the respondents.  The report does give some demographic data but how CPA found these 2766-odd people could affect results.  If CPA depended on respondents to contact CPA then that might tend to skew the results toward people who were motivated for some reason. Since CPA represents the people who look after payrolls across the country, the responses might be skewed if the respondents knew the person from payroll was asking questions about their job security and personal finances.

These sorts of details matter when it comes to the results.

If you don’t think so, notice that one of the questions was about confidence that the person preparing the regular paycheque got it right. Forty-eight percent were extremely confident, 38% were very confident and 10% were confident.  That’s 96% incidentally.

And if you think that might not be important, notice that in most provinces the total number of respondents was very small.  Just 16 people answered the survey in Newfoundland and Labrador. 

That might not matter in a national poll designed to sample the opinion of all Canadians on a few general questions.  But on a political poll, it could matter quite a bit.

Even on a regional or provincial basis, you can get plenty of skewed results based on who gets surveyed.  A recent opinion article in Campaigns and Elections predicted that 2012 will be the last presidential election in which pollsters rely on landline telephones for collecting data.  Already 25% of Americans use cellular phones as their primary means of making telephone calls. The demographic that goes with that – young, African-American or Hispanic – is also an important one for some races or aspects of the bigger picture.

The situation is much the same in Canada.  Researchers are having a harder and harder time getting people to spend the 15 or 20 minutes to do a telephone survey.  A sample of 400 respondents might mean trying to contact over 6,000 people. And while cellular telephone usage might not be as significant in Canada as in the Untied States, other issues can affect results.  Even in a province like Newfoundland and Labrador, language, comprehension (literacy) levels and social and cultural factors can all have an impact on results.

So when you look at a news story about another poll, don’t just take the results at face value.  Go looking for more information about how the poll was conducted.  Sometimes you might turn up some details that affect your perception of the poll and the news story based on it.

- srbp -

A-ha! Update:  An excellent story in the Tuesday Telegram (not online) raises questions about this poll.  According to the article, the survey went to local payroll officers who sent it out to employees for response.

That accounts for the varied response rates (16 in NL, 193 in QC and 500 in ON) and, as the article acknowledges, likely would affected the ability to take attitudes about the economy and extrapolate them to regions.

Of course, it also explains why 86% think their payroll officer is doing a fine job, but that they just need to keep those cheques coming to avoid personal financial disaster.  Even if it wasn’t true, what else would you tell the person who makes sure you get paid?

07 May 2010

How do you know it’s polling month?

Sure there is a sudden uptick in the number of happy-crappy announcements about everything from water bombers to smoother roads.

But you can really tell it is polling month because of this.

-srbp-

06 May 2010

The Polling Month Issue

Yes, CRA is in the field again.

No, not Conestoga-Rovers and Associates doing more environmental work for Charlene in the battle against the Great Satan of the Moment.

Corporate Research Associates.

While many of you might think something else might wind up being a big issue in public during that time, offshore drilling might well top out whatever you’ve got on your list today.

The Globe’s got it started with questions about Chevron’s planned deep water exploration well offshore Newfoundland.

And @cbcnl Morning Show in St. John’s is adding to the discussion with comments by biologist Bill Montevecchi who had a go at all comers, including the offshore regulatory board.

Let’s see how things shape up.

-srbp-

Imho-humtep Update:  This story is not going to develop any traction whatsoever if the best anyone can do is start quoting implacable offshore drilling foe Ian Doig.  Apparently someone has managed to resurrect Doig for a quote.

If all we get to listen to are people who thought Hibernia was a bust then let’s just quote Wade Locke and be done of it.  Next thing you know we’ll be hearing about aluminum smelters in Labrador again.

16 March 2010

Satisfaction with Williams gov drops 13 points

What’s the difference between approval and satisfaction?

Well, quite a lot according to Newfoundlanders and Labradorians surveyed during February by two polling firms.

A Corporate Research Associates poll conducted between February 9 and February 25 showed public satisfaction with the Danny Williams administration at a record 93% percent.

But a new survey by Angus Reid conducted during the same time period (February 16 to 23) showed that only 80% of Newfoundlanders and Labradorians approved of Danny Williams’ performance as Premier.

The Angus Reid poll has a lower margin of error at 3.9% 19 times out of 20 compared with CRA’s 4.9%. in addition to a news release, Angus Reid also released a description of the polling methodology and details on the poll itself.  CRA does not release that information.

What this really shows, though, is the gigantic discrepancy between CRA and other pollsters in their results.  The problem with CRA polls is highlighted by the difference in results between AR and CRA for Nova Scotia.  The Angus Reid poll also highlights a huge discrepancy between the AR poll and CRA’s results on a similar question in Nova Scotia. 

According to CRA:

Satisfaction with the NDP government declined even more significantly, with one-half of residents satisfied with the overall performance of the government (49%, down from 63% three months ago).

But according Angus Reid, the Nova Scotia government led by New Democrat Darrell Dexter has only 23% approval down from 49% in November 2009.

Bond papers has contended for some time that CRA polls are wildly inaccurate measures of public opinion.


-srbp-

16 February 2010

Government probing attitudes on private health care, education

According to someone who participated in the current poll by government pollster Corporate Research Associates, the provincial government questions focused on attitudes to private delivery of publicly-funded health care. 

The question or questions presented a range of options from private collection of blood for testing to private operation of hospitals.

Other questions probed attitudes about the effectiveness of the province’s education system.

Some questions included the phrase “Williams-led” or “Danny Williams-led” government. 

That sort of wording would have the potential to skew the poll. CRA reports some of its poll results publicly in a way which is viewed by the research industry as misleading.

-srbp-

06 January 2010

Alberta poll in question

Ye, verily, lo and behold, good citizens:

There are problems with reports coming from Alberta about the Wild Rose party and polling.

Sounds very familiar.

One thing leaped out in particular and this had to do with the reliability of online surveys:

Unbeknownst to most Albertans – even many politically savvy ones and apparently to most political journalists, too – was the import of this statement.

First, this is an on-line survey, based on interviews with a group of Albertans, obviously interested in politics and quite possibly committed to a political party, who selected themselves for the job.

The advantage of on-line panels of this type is that they’re inexpensive to conduct. The disadvantage is that their results cannot be called scientific and they are not particularly credible.

Also unknown to most Albertans following this story is the fact that the phrase “margin of error is 3 per cent” is highly controversial in professional polling circles when applied to this kind of survey.

The implication is that the survey was based on sound scientific methodology and can be counted on to be accurate within a margin of 3 per cent.

The fact is the survey is based on the opinions of people who selected themselves to join the panel and answered questions on-line. In other words, this is not necessarily a particularly trustworthy poll.

That probably refers to issues like the ones raised in this businessweek.com article in 2008.

And it points out again why reporters need to ask more questions about polls and pollsters before they report the results.

Lie say this little gem from an American association of polling firms giving 20 questions journalists should ask about polls:

6. Are the results based on the answers of all the people interviewed?

One of the easiest ways to misrepresent the results of a poll is to report the answers of only a subgroup. For example, there is usually a substantial difference between the opinions of Democrats and Republicans on campaign-related matters. Reporting the opinions of only Democrats in a poll purported to be of all adults would substantially misrepresent the results.

Poll results based on Democrats must be identified as such and should be reported as representing only Democratic opinions.

Of course, reporting on just one subgroup can be exactly the right course. In polling on a primary contest, it is the opinions of those who can vote in the primary that count – not those who cannot vote in that contest. Primary polls should include only eligible primary voters.

Yes, ladies and gentlemen, reporting poll results as a percentage of “decideds“ is “one of the easiest ways to misrepresent the results of a poll…”. Some people won’t be shocked by that nugget.

If you scroll down you’ll also find a good section that points out methodological problems with online poll results.

And that’s before people misread news reports that seemed to suggest Danny Williams scored a 70% approval rating with all Canadians surveyed by Angus Reid last fall during the local poll goosing month of November.

At some points, local news organizations will either stop reporting obviously unreliable poll results or hold off until they get answers to some tough questions from the people flogging the polling fodder.

-srbp-

03 September 2009

Two wrongs… and you get a news story

Both VOCM and the Telegram incorrectly reported the latest poll results from government sponsored polls on Thursday.

VOCM reported that the “latest numbers from Corporate Research Associates show Danny Williams and the PC's gaining strength, despite being almost halfway through their second term.”

The Telly reported that the “province’s decided voters are showing more support for the Progressive Conservative government…”.  The story is on page three of the Thursday edition but isn’t available online.

As a famous politician likes to say,  nothing could be further from the truth.

Both reported the numbers given in response to a question on which political party respondents would pick if an election were held tomorrow. 

The problem comes from the fact that the provincial government’s pollster – Corporate Research Associates – gives its results as a percentage of decided voters, not as a percentage of all people whose answers are included in the poll data.  The change in the number of undecideds can affect the relative share of decideds any one party has.

07 August 2009

You know its polling season

1.  An announcement about fibre-optic something or other.

2.  An announcement about energy something or other.

3.  Money for road paving, announced again and again.

There must be some really intense concern on the 8th that the public mood needs a lot of extra help to be happy for the pollsters this summer.

-srbp-

11 October 2008

Dear Conrad...

Get a grip.

Obama was leading McCain before the meltdown.

McCain's miserable performance in the wake of the economic crisis has only worsened his position.

Some recent polls have Obama as much as 11 points in front of McCain nationally. Even Fox News analysts would have to reach to claim Obama is "fighting" to hold on to a "slim" lead.

That's nothing to shake a stick at.

It starts to get worse for McCain when one notices the shifts occurring in key demographic segments to Obama and away from McCain/Palin.

As for the Bill Ayers thing, the most spectacular point is that the McCain/Palin attack on that point has had almost no discernable impact on the latest Obama surge.

Perhaps your analysis is -  in a word -  simplistic.

Ditto the Canadian stuff.

In the past week or so we have seen the Conservative support in Quebec tumble as a direct response to Conservative messaging gaffes. No minor issues;  major gaffes.  The Conservatives who were poised to increase the Quebec riding count will now struggle to hold on to what they have.  Some numbers suggest their riding count will be halved.

Numbers have shifted dramatically in key Ontario ridings and even in British Columbia there has been a noticeable shift in voter intentions.

This hardly favours the Conservatives "one way or the other".

Far from being a case where voter intentions were solidly formed long ago in an election that may see "a "watershed" that changes fundamental voting patterns and party dominance for years to come", the current Canadian federal election is an example of how even front-runners can prove unpalatable to the majority of electors based on elector experienced with them.

Evidently there's something sitting close to Conrad's compass that is skewing his perspective.

-srbp-