Showing posts with label poll goosing. Show all posts

02 October 2011

CBC torques poll coverage #nlpoli #nlvotes

Think of it as another form of poll goosing.

As an example of how news media can take a piece of information and make a false statement out it, consider CBC’s online version of the story about a poll released Friday by the same company that polls for the provincial government’s energy corporation.

“Liberal support in free fall” screams the headline.

The first sentence is less dramatic:

A public opinion poll released Friday suggests that Newfoundland and Labrador's Liberals have lost even more ground leading into the last half of the Oct. 11 election campaign.

There’s even a graphic that uses the numbers from the news release.  They show a drop of five percentage points in decided Liberal support, according to the poll.

The only problem for CBC is that the headline and the lede are false.

The combined margin of error for this poll and the one before it is more than the five point drop shown in the report numbers in the two polls..  Therefore, the actual numbers for the Liberals fall within a range of 4.5 or 5 points above or below the figures given.

This is why polls with such large margins of error tend to be useless for most meaningful purposes.  And for detecting trends, you’d have to see a huge drop between polls – like more than 10 points -  in order to get something that could conceivably be called a significant change.

What would free fall look like? 

Well, certainly a hell of a lot more than what is shown.  10 points or more would be a likely candidate for such dramatic language, especially over the course of a mere 10 days or so.

m5It’s also interesting that while CBC mentioned a relationship between MQO and advertising company M5, they didn’t mention that MQO is also Nalcor’s pollster because it is owned by M5. The advertising company is Nalcor’s agency of record.

mqCBC also said MQO was “affiliated” with M5.  That’s not even close to correct either. 

According to the provincial registry of companies, the same three men are the only directors of M5 (above), MQO (right)and all the companies within the M5 Group.

MQO is owned by M5. 

That’s factually correct.

“Affiliated”? 

That would be misleading bordering on deceptive.

- srbp -

Related:

20 September 2011

New Poll. New Result #nlpoli

Quick.

Where’s Kathy Dunderdale today?

A new poll by advertising agency M5’s opinion research firm will give you a clue.

The poll replicates the actual numbers for CRA’s August omnibus when both are adjusted to remove the distortion of reporting voter choice as a percentage od decideds.

The MarketQuest Omnifacts poll showed the provincial Conservatives with 42% of respondents, the New Democrats at 23% and the Liberals at 145 with the undecideds at 20%.

The margin of error was plus or minus 4.9%, 19 times out of 20.

The CRA corrected numbers were 40 Tory, 18 Dipper,  and 16 Grit with 26% undecided.

Run that through the Amazing SRBP Vote-a-matic and you get a possible seat result of:

  • PC:  38
  • Libs: 4 to 7
  • NDP:  3 to 6

So contrary to what Kathy “New Energy” Dunderdale said on Day One of the campaign, the polling shows the Tories will lose seats.  The question is more one of where they’ll lose them and to whom.

if you want an idea, consider that on the basic math of it the Tories have gone from 70% of votes cast to 53% of decided voters.  Bear with this for a second and switch back to using the numbers everyone else is using.

That’s a drop of 17 points since the last general election.

If you look at the seats the Tories won by a margin of 17% or less in 2007, this is what you get:

  • Lake Melville
  • Bellevue
  • Labrador West
  • Bay of Islands
  • Torngat Mountains
  • Humber Valley
  • Isles of Notre Dame

On the face of that list right now, your humble e-scribbler would add an extra New Democrat in Labrador West to a future House of Assembly with the other seats being ones where the Liberals are historically strong and would likely pick up.

That would give you 10 Liberal seats total and that’s outside the Vote-a-matic forecast range. Just remember that this is a highly inexact subject.  What you can take away from it are places to look for further signs or information. And after all, when the poll results have a variation of five percent give or take, you are really not dealing with scalpel-like precision anyways.

For those who want to quibble, too, that this result would show the Liberals gaining more seats with fewer votes than the New Democrats, you need to appreciate that this set of observations on seats is based on taking polling and applying it against history, against what happened before.

Add to that the concept of vote efficiency and how it works in the current system.

The best example to use is the 1989 general election.  The Tories got more votes, but the Liberals took 34 seats on election night.  The Tories, for example, tend to show very well in polls.  They rack up tons of support in districts in St. John’s but once they’ve gotten enough votes to win the seat every one after that is a waste.

Well, it’s a waste from the standpoint that they didn’t need it to win.

Meanwhile over in another district – most likely off the northeast Avalon – the Tories are starving for votes.  The Liberal vote is distributed such that lots of votes don’t get wasted racking up margins beyond what you need to win.

Same thing applies, essentially, for the NDP.  They’ve got a couple or three pockets of strong support. It’s been enough to win two seats, historically.  And that’s about it.

Historically, you’d translate those polling numbers out and get a result in which the Tories could drop seven seats to the other two parties.

You likely won’t see this from the conventional media, but then again, the conventional media can’t get much beyond the superficial horse-race commentary.

All you can do, dear reader, is take it all in,  weigh it out and make up your own mind.

Oh yes. 

And notice where Kathy Dunderdale is today.

Labrador.

- srbp -

03 September 2011

Looking beyond normal

labradore wasted no time in converting the numbers from Friday’s editorial in the Telegram into a chart to show the number of money announcements issued by the provincial government in each week in August for the past four years.

The Telegram editorial uses these numbers to refute Premier Kathy Dunderdale’s claim that:

“There’s nothing going on here now that hasn’t gone on every year since we’ve brought down a budget, no matter who formed the government,..”

She made the comment.  They counted the news releases.  Way more, finds the Telegram, so therefore “liar, liar pants on fire.”

Or words to that effect.

In defence of Kathy Dunderdale, there is nothing that her provincial Conservatives did in August 2011 that is different in kind from anything the provincial Conservatives did in any other one of the four polling months each year since 2004..

The fact that there are more money announcements in 2011 is really much ado about nothing.  Sure the whole thing is so outrageous in August 2011 that the local media couldn’t ignore it any more, but other than that this is just another Tory poll-goosing month.

And the fact this is an election year doesn’t really make the Dunderdale version stand out.  Scroll back through the archives list of these e-scribblers for the summer of 2007.

Summer of Love.  On August 18, your humble e-scribbler note that the Tories seemed to be inventing excuses to issue happy-news releases.  25 additional campsites at a provincial park, for example.

Toward the end of July 2007, you’ll find a post about the spate of announcements comparing July to previous Julys:

Note, however, that cash announcement in the 25 days of July 2007 already done are already at the same level of 2004 and they are double those of 2005 and almost quadruple those of 2006.

The post starts off with a quote from Danny Williams that will look awfully familiar:

Flanked by two Progressive Conservative candidates in Bay Roberts, Premier Danny Williams told reporters on Wednesday that what government has been doing over the past couple of weeks is just government "carrying on business."

What really stands out in the Telegram figures is the big jump in 2010 and the larger jump in 2011. Poll goosing and the pre-election impetus – the Telegram’s point – are just penetrating insights into the stunningly obvious. Something else is going on.

It’s the trending that shows up when you look beyond the polls as most people misinterpret them. In May this year, your humble e-scribbler pointed out that the Tory polling numbers have been slipping pretty significantly.

This chart shows CRA polling as a percentage of actual respondents not of “decideds”.  That second hard point from the right shows the results of last August’s jump in cash announcements.  And the reason for it is the slide the quarter before.

But then look what happened over the next three months before Danny Williams left abruptly.

Big slide.

And in the months since then, the Tories have continued to slide downward.

They were at a point in May where losing a raft of seats in October looked like a very real possibility.  As noted around these parts last May, if the trends continued the Tories would be even weaker in August.  The leader numbers could also continue their downward trend to the point where all three party leaders shared the same distinct lack of interest from voters.

So if you were the incumbent party headed into an election with public support apparently weakening,  you’d pretty much be guaranteed to do the only political thing you know how to do:  take as many spending announcements as you can type up and e-mail them out to try desperately to stop the spiral in the polls.

As far as Kathy Dunderdale and her crowd are concerned this is normal.  For the rest of us, though, you have to look a little beyond the obvious to figure out why their “normal”  is even more “normal” than usual.

- srbp -

02 September 2011

The Old Blue Goose

When the three posts on the provincial Conservatives’ communications strategy first appeared here in August and September 2006,  people who had never heard of it thought the ideas were preposterous.

The relatively small number of people in the province who knew what is going on  - politicians, political staffers and some media types - tried to dismiss it as irrelevant or as old news.

Five years later, the basic ideas are known to anyone who follows political stories in the local conventional media.  Once someone pointed out the patterns, others started to notice them too.

Then two professors at Memorial University did some research and confirmed the pattern of calls to open line shows and other aspects of the strategy.

Essentially, the three posts boil down to this:

  • The government party times its media activity to coincide with the polling periods of its own pollster.  Four times a year, the provincial government’s communications office pour out news about new projects, road paving and government spending.  “Playing the Numbers
  • All newsrooms are not equal. News media coverage plays a key role in selling the party in power to voters.  The provincial communications strategy favours news media that will offer the best chance of getting their messages out as often as possible and with the least amount of filtering.   “The media and the message
  • Government uses public opinion polls to help shape public opinion, not measure it.   The government party floods radio call-in shows with partisan supporters, including cabinet ministers, during polling periods to generate positive coverage during polling months.  The polling results then become part of the effort to suppress dissent:  the government is right because it is popular and popular because it is right.  The polls say so. “The perils of polling

August is one of the months in which the government’s pollster is in the field.  Not surprisingly, the current provincial governing party has been heavily pushing its happy-face news releases.

Also unsurprisingly, when asked about it, the leader of the governing party dismisses the idea the storm of news releases and spending announcements is about anything but informing the people of the province about government initiatives.

She promises the whole thing will stop at the end of August She doesn’t mention that the government’s pollster has stopped or will shortly stop gathering data so she and her political friends are done with poll goosing …for now.

- srbp -

30 August 2011

Dead Robots in Heat

So the old poll goosing habit dies hard.

There’s the robot poll goosing of the Question of the Day at Voice of the Cabinet Minister. Think about it:  such a habit, they’ve now automated the process.

And in its editorial on the last Monday in August, the Telegram editorialist reminds us all of another old poll goosing habit the provincial Conservatives have:

Cheers: to numbers and money. Maybe you like Lotto 6-49 or LottoMax. Here’s a set of monied numbers for you to choose from: 29, 30, 39, 23, 19, 32 and 43. Those are the weekly numbers of funding announcements (and announcements of pending funding announcements) made by the provincial government as it staggers along under the weight of its campaign cash backpack. This past week has marked the heaviest handouts to date, with money for everything from turbot to rock-climbing to airline subsidies. Premier Kathy Dunderdale pointed out recently that past governments made announcements right up to the start of the official campaign. “I’m not going to do that,” Dunderdale told reporters. “By the end of the month, these announcements will conclude.” Nice to know there is a scheduled end to the non-pre-election spending program.

Yes, friends, the government’s pollster is in the field in August and so it is time for the quarterly gush of money announcements all in an effort to ensure the governing Tories’ polling numbers stay up.

The intensity of the activity this summer, though, stands out.  It stands out because they Tories seem to be trying to prop up the last media poll before the fall election.  The party has been having an especially bad time since Danny Williams left them unexpectedly – and rather hurriedly – last December.

Kathy Dunderdale’s popularity numbers are low. They are slow low and the trending is such that any further drop would really start to shift public perceptions of the election outcome in October.  They might not be quite so willing to accept that the ruling Tories are guaranteed of a majority if Dunderdale’s numbers in August continue the downward slide.

The media might not be able to ignore the trending.

You see, even aside from the year long trending downward for the Tory polling numbers, the change in Liberal leader, the disastrous Muskrat Falls review report and/or or the orgy of coverage of Jack Layton’s funeral might cause a shift of its own.

Get that story  - that Dunderale is in trouble - running around in September and see what happens. That prospect likely frightens the living crap out of the Tory party campaign managers.

Heck, it would frighten any political insider no matter what the party.

And it will definitely scare the crap out of Kathy Dunderdale.  Her length of time as Premier is inversely proportional to the number of seats she loses in October.  The fewer she loses, the longer she can stay.

If she drops below 34 seats in total  – the magic number for some local politicos – you can expect Dunderdale to go within 18 months.

With that on the line, there’s no wonder that the Tory party poll goosing efforts are in some sort of manic overdrive this month.

- srbp -

29 August 2011

Robots in Dead Heat

As labradore notes, the latest question of the day online poll at Voice of the Cabinet Minister comes close to setting a record for vote totals.

It is second to another question about Muskrat Falls from last December.

Just so everyone is clear:

  • Both the “Yes” and “No” votes are the result of someone deliberately dumping huge numbers of votes in here using computer programs.
  • The governing Conservatives have been at this foolishness for years and used to get paid political staffers to sit there and manually click the button whatever way they wanted to see the vote go. It seems they’ve now deployed computers.
  • Someone else has been auto-voting for the past three or four years likely just to frack with the Tory staffers.
  • As labradore notes, VOCM disabled the “Yes” option over the weekend so that the people trying to push the vote against the government’s preferred answer to the question couldn’t get any more votes in.
  • VOCM will report these results as if they were news.  Call-in hosts will use them to prompt calls, most likely without mentioning that the thing is complete bullshite.


- srbp -

23 August 2011

The secret of life, comedy, and politics

Timing.

The ever watchful labradore notes that after Danny Williams mucked around with the appointments for the Order of Newfoundland and Labrador, they have taken place in November.

No one would be surprised to find out that this is a month when the government’s official pollster is in the field.

In Election Year 2011, the appointments announcement arrived in August.

Not surprisingly, the government pollster is in the field at the moment as well.

- srbp -

31 July 2011

The Summer of Love 2011

Five years after your humble e-scribbler first wrote about it, the world pretty much accepts the notion that the governing Conservatives time their communications to coincide with polling done by their contract pollster. A couple of university professors have taken up the task of documenting the extent of the poll goosing and talk radio stacking activities.

Well, labradore posted a couple of reminders last week about just exactly how intense this can get.

First, he show a chart comparing the number of releases issued in the middle of summer.  Not surprisingly, 2011 showed the heaviest news release output on record.  That’s not surprising because it is an election year and the the incumbent Tories apparently are having some problems with popular support.

Second, labradore charted the number of media advisories issued by the provincial government, by month from 1996 onward. No one ever said this poll goosing thing was something the Tories invented.  It’s just that they do it more aggressively than the gang that went before.

- srbp -

16 May 2011

Talk radio on agenda for national political science association

Memorial University political science professors Matthew Kerby and Alex Marland are looking at politics in the province and talk radio again.

This time they are delivering a paper at the annual meeting of the Canadian Political Science Association being held at the University of Waterloo this week.

Here’s the short version of their presentation titled “Government Behaviour and Talk Radio in Newfoundland and Labrador”:

Existing qualitative research on the relationship between talk radio and executive behaviour in the province of Newfoundland and Labrador highlights a number of key themes which set the province apart from its contemporaries. These themes include the following: line-stacking, the manipulation of scientific opinion polls and a strong sensitivity as far as purchased scientific opinion polls is concerned. This current research builds on previous efforts by conducting a first round of quantitative analysis on freshly collected data. Specifically, we examine provincial politicians' talk radio presence with respect to frequency, discourse content and opinion poll timing for the period 2003-2010. We also report on how the provincial government in Newfoundland and Labrador compares to other Canadian provinces as it relates to spending on public opinion data and collection. Our results shed further light on government behaviour in an often-neglected provincial case.

- srbp -

28 March 2011

Trolling for Dollars

Susan Delacourt’s got a screen cap of an ad that appeared on Craigslist looking for people to post Conservative talking points on social media and other Internet spaces.

While the federal Tories seem to have a great deal in common with their provincial cousins – Danny Williams’ laughable claims to the contrary notwithstanding – seems that Dan-o never had to pay people to troll for him.

Did he?

- srbp -

07 March 2011

Dunderdale boosts Tory support from last Williams poll: government pollster (revised numbers) #nlpoli #cdnpoli

Corporate Research Associates issued a correction to its latest polling numbers for Newfoundland and Labrador on Monday and the result is truly startling.

The Conservatives under Kathy Dunderdale have the support of 56% of voters compared to 51% for the Tories under Danny Williams in November 2010.

Sure her personal popularity may be less than Danny’s but she’s managed to pull the Tories out of their downward slide in Danny’s last three months that took them from 61% in August to 51% in November.  Dunderdale’s started the Tories back on the path to the stars and without doing very much of anything for the past three months except fend off a weak challenge to her leadership by Brad Cabana.

Not surprisingly, the Conventional media are following along with CRA’s news release and their own conventional wisdom to make the poll numbers fit what they think the numbers should say.  They are saying that Dunderdale is not as strong as Danny but she is still pretty big.

But as absurd as it may seem, the CRA numbers really put Kathy ahead of her old patron.

According to CRA’s revised numbers, undecideds dropped from 31% to 23% in the three months or so Danny’s been gone.  The unfiltered, undistorted CRA numbers show Tory support went from 51% in November with Danny as leader to 56% with Kathy Dunderdale.

Both the change in party support for the Tories and the change in undecideds is outside the margin of error (4..9 percentage points)

“How could this be?” you are likely asking.

Call it the mother of all typos.

The original news release included this sentence:

Those with no stated preference included those who were undecided (18%), do not plan to vote (3%), or refuse to state a preference (18%).

That adds up to 39%.

The table at the end of the news release gave the figure as 23%.  Apparently that second 18% was only supposed to be two percent.

Not 18.

2.

Big difference.

It’s a bit of a head scratcher as to how someone could mistakenly type “18” instead of “2” and how the release could get out the door with such a glaring error.

Your humble e-scribbler took the figures in the text of the release in largest part since they were consistent, across the board with a similar poll done by NTV/Telelink in February.  Those are the figures used in an earlier post

Now what we are left with is a poll that mirrors Telelink in every way except in Conservative support and the level of undecided/no answer and will not votes.  The differences are hardly inconsequential. 

What this cock-up really should be is a reminder that CRA’s poll reporting does contain some rather glaring problems.  For instance, CRA routinely distorts the results of its polls by presenting only the results for decided voters. You can see the effect of that misrepresentation by charting the results as a share of all responses, not just the “decideds”. This chart is taken from post last December on CRA’s fourth quarter poll.

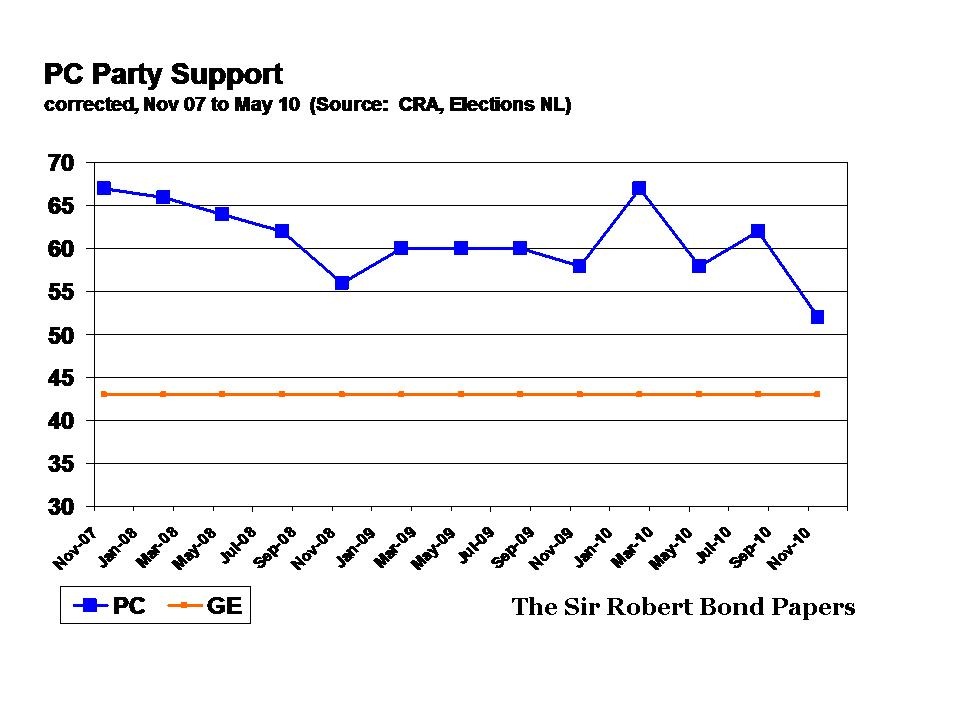
According to CRA’s version, the Conservative party’s support remains in the mid 70s. What doesn’t get noticed is that the “undecided” category has gone from the teens to 31% in November 2010.  Now it’s dropped again to 23% in the most recent poll.

You’ll also see in the middle of that chart another clue that something is seriously wrong with CRA’s polls.  That flat line in the middle would be a period of three consecutive quarterly polls where the difference in Tory support was apparently less than one percent. Those interested in a more detailed discussion can find it in an older post:  There’s a fairly lengthy post that discusses most of the major problems with CRA polling:  “How the Tories get 28% more votes thanks to CRA”..

For the first time in a long while, CBC has added a few questions to CRA’s quarterly polling.  Ostensibly they give new information, but essentially, CBC just gives a variation on the basic horse race questions. One of the CBC questions even repeats the same flawed question format of “mostly” and “completely” and equally extreme negative choices.  On other occasions, incidentally, CRA has asked a typical five point Likert scale (strong and moderate positives and negatives with a neutral) and reported the results as “completely” or “mostly” as appropriate. 

What is the difference, after all, between completely and mostly, compared to completely and somewhat?  think about it for a second and you’ll get the point.

What’s missing in all the questions is the sort of stuff that would give any indication of what Newfoundlanders and Labradorians are concerned about.  What pollsters typically do is ask what issues are of concern to their respondents.  Then they might ask voters to rate party performance on each question.  Sometimes they might leave out the party support questions so as not to unduly influence the responses, but with or without it, one can get a much better sense of what potential voters are thinking.

Instead of some insight, one gets absurd responses.  For example, when asked whether Williams departure will influence party choice (the question itself is oddly worded, by the way), 34% said they were less likely to vote Conservative while 30% said they are more likely. 

Huh?

Exactly.

And don’t forget the Conservatives supposedly enjoy 73% voter support  - using CRA’s own method of reporting - with only 18% actually undecided in their party choice.

And as a last point, let’s just remember this basic point.  CRA polls eligible voters.  They don’t screen for usual voters or regular voters.  They just survey all eligible voters. That means you need to compare their poll results, including UND/DK/NA with the actual poll results for any given election.

In their Fall 2007 quarterly survey, CRA put the combined no answer/will not vote/undecided at a mere 18%. The actual result on polling day was 38%.  CRA’s quarterly polls typically show that the “will not vote” category is less than five percent.

-srbp-

Tories at 44.5%, UND at 39%: government pollster #nlpoli #cdnpoli

Double-down Update:

  • CRA's issued a correction that its UND category was 23% as shown in the table not 39% shown in the text.  That's one mother of a typo and therefore that's worth a whole new post, coming later.
  • CBC apparently piggybacked on this one and has some specific questions of its own coming later on Monday evening.  That would warrant a separate post on its own.
  • New post:  “Dunderdale boosts Tory support from last Williams poll

Original Post begins...

Support for the ruling provincial Conservatives under Kathy Dunderdale is at 44.5% compared to 61% last August under Danny Williams according to a Corporate Research Associates quarterly poll released on Monday.  The results match almost exactly with a recent NTV/Telelink poll that put support for the province’s Tories at 44.3%.

Undecided, including those who refused to answer and those who do not plan to vote is at 39%, up eight percentage points from CRA’s November 2010 poll.  NTV/Telelink reported 37.9% of its respondents didn’t know how they might vote, wouldn’t state a preference or indicated they would not vote.

And that’s where the real story is for these polling numbers.  According to CRA’s polls, support for the provincial Conservatives started to slide during the last three months of Danny Williams’ leadership.  His abrupt departure didn’t stop the slide.

What’s worse, the margin of error for this poll is 4.9%.  That means there is a possible variation in those numbers of almost 10 percentage points.  Given that the Tory and UND number is less than 10% is it possible that more people are undecided or won’t state a preference than are actually indicating they will vote for the provincial Conservatives.

There are problems with the way CRA presents its figures.  For example, they show party choice for decided voters.  This is highly misleading as can be seen in the party vote numbers. The obvious decline in Tory support vanishes completely because of the way CRA reports its figures.

Still, if you look at the numbers, understand what you are seeing, and can check them against a second set of figures like NTV/Telelink, the results can be dramatically different than what you will see reported by conventional media.

These poll results from two different firms don’t  mean the Tories will lose the next general election.  What they do show is an electorate which is sufficiently uncomfortable that they will not state a clear support for the ruling party.  The fall general election could be up for grabs, depending on what the Conservatives and the opposition parties do over the next three to seven months.

- srbp -

06 December 2010

Tory support drops sharply

Support for the province’s ruling Conservative Party dropped by about 10 percentage points in Danny Williams’ last month in office according to a poll released on Monday by the provincial government’s official pollster.

Corporate Research Associates reported that 75% of decided respondents to a survey said they would vote Conservative if an election were held tomorrow.

CRA reported that the undecided, do not know and will not vote categories amount to 31%.  In itself, that’s the largest UND reported by Corporate Research Associates in the past five years.  It’s also up dramatically from the 19 percent reported in August.

cra nov 10 correctedWhen you adjust CRA’s party support number to show as a percentage of all respondents, the Tory vote drops to 51.8% from the 61.8% reported three months earlier. The graph above gives the CRA polling results since the last provincial election, adjusted to show the responses as a percentage of all respondents.  The reddish-brown line shows the actual Conservative vote share in the last provincial election – 43% - shown as a share of eligible voters.  That’s the same basis on which CRA polls.

Don’t get overly excited by the gap between the two lines though.  It illustrates the extent to which CRA’s polling is out of whack. 

Except for a couple of odd drops or climbs (November 2008, February 2010 and August 2010), the Conservative support has been declining steadily since CRA’s first post-election poll. The drop overall has been from 67% in November 2007 to 52% three years later. There’s even a bizarro period in the middle where the party support was within fractions of a percentage point for nine months consistently.

If you accept the drops and spikes, the Tories have dropped from 67 to 52 since February 2010.

There are a few things to bear in mind when looking at CRA polling numbers.  First, it is well established that the provincial government organizes its political communications to influence the outcome of the quarterly poll.  Second, as the actual 2007 election result shows, CRA also gives poll results that are significantly different from actual election experience.  In 2007, CRA’s results show the Conservative vote to be much higher than it was on election day and radically underrepresented the “will not vote” by approximately 20 percentage points.

Even allowing for those considerations, the Tories appear to have experienced a dramatic decline in voter support in a relatively short span.  Neither the Liberals nor the New Democrats picked up the disaffected vote, apparently.

Nonetheless, this poll shows the extent to which the Conservatives were bleeding support even before Danny Williams announced his departure.  What happens in the 10 months to the next provincial election will hinge on developments over the next five to six months.

The Conservatives will pick a new leader and bring down a new budget.  They also face labour and other problems across the province.  A significant number of voters in the province look like they have decided to wait and see what happens.

Keep your eyes fixed on the February polling period.

CRA’s news release was not available on line as of 1430 hours Newfoundland Daylight Savings Time.

- srbp -

24 November 2010

The political uses of talk radio

From a story on the front page of the Wednesday Telegram:
Open-line has little impact on the formation of big-picture public policy, but does have a strong effect on government behaviour, with political actors paying "considerable attention" to what is said on VOCM. 
That has translated into partisan efforts to control the frequency, as it were - intense monitoring of open-line programs for rapid reaction to issues that may arise; promoting party positions through stacking the lines to suggest grassroots support; and using the airwaves to avoid answering difficult questions from other media outlets.
Sadly, it isn’t available online unless you are a Telly subscriber.

The story discusses an article by Memorial University political scientists Alex Marland and Matthew Kerby who conducted a detailed study of politicians and talk radio in the province.  As part of the research, Marland and Kerby compiled statistical analysis of callers, frequency of calls and dates as well as a series of in-depth interviews with politicians, political staff and journalists.

Regular readers of this corner of the universe will recognise the discussion, for example, in this section of the Telegram story about planted callers,
Marland and Kerby found that the limited pool of callers to open line presents "a very serious credibility gap," with line-stacking so prevalent it is believed that the lines are monopolized by a pool of just 30 to 100 callers. 
"The prevalence of political calls questions whether the openness and spirit of talk radio is supplanted by parties' efforts to control the shows' content," the MUN researchers note in their paper.
There’s also a section on poll goosing, that is timing announcements and open line activity to coincide with CRA polling periods.

And the bizarro attention paid to VOCM Question of the Day? Here’s a tiny bit of the Marland and Kerby take on things:
One respondent provided us with tabular data of efforts to influence the outcome, which involved hundreds of automated repeat votes that were critical of Williams, and which almost instantly provoked an apparently automated response supporting the premier. This occurred only during the workday and not in the evening (one minister told us that party staff‘go crazy’ clicking during the day).[Note:  Marland and Kerby here are referring to political staff working in government offices]
The one thing they really don’t make clear is that the level of this sort of activity since October 2003 dwarfs anything that went before.  Some people may like to think otherwise, just as some people like to deny this sort of stuff goes on at all. The evidence speaks loudly for itself, however.

“The audience is listening: talk radio and public policy in Newfoundland and Labrador" is available in the November 2010 issue of Media, Culture and Society, a peer-reviewed journal of research on communications and society. Individual articles are available for purchase online or through your local library. 

The Memorial University Library subscribes to MCS for those who can access it.

- srbp -

22 November 2010

Lower Churchill opinion: The End

The votes are tallied and despite an overnight dump of about 20,000 electronic “votes” the forces desperate to goose the VOCM question of the Day in favour of the Premier’s Lower Churchill proposal came up short.

lowerchurchillqotd

If they weren’t obsessed with this sort of trivia, imagine what they could have accomplished.

- srbp -

21 November 2010

Lower Churchill Opinion: the Battle of Shallow Valley

Helms Deep, it ain’t.

The struggle between the clicks overnight changed the results of the VOCM question of the day.

The VO computers have registered over 45,000 votes and the “No” side is back on top.

qotd083021nov

The Reform-based Conservative socks have evidently been busy, but not quite busy enough.

Don’t be surprised if they redouble their efforts after a night’s sleep, a case of Red Bull, a few hot pockets and some cold packs for their wrists. The Old Man would be mightily displeased if Gerry Phelan had to report a loss in so vital a test of political strength, especially during poll goosing month.

Updated:  verb tense corrected and a set of related links added.

Edward R. Murrow Flashback Update:  It’s like da blitz, b’ys.  As of 1300 hours local on Sunday, the QOTD is showing about 46,500 votes and the numbers are still running heavily for the “Hates It” forces.

At this rate, the “Loves It” crowd will have to push the total vote to over 100,000 to get the 70/30 split they drove for on Saturday.

That would be an all-time vote record and could well crash the VOCM system for only the second time in the history of the idiocy.

- srbp -

Related:

Lower Churchill opinion: and then, like magic…

[Note:  This was originally written on Saturday night and time-delayed until Sunday morning.  However, as events overnight changed the story, here it is with a new post to update is on the way.]

______________________________________________

The poll goosing army got its act together.

A little over 12 hours after your humble e-scribbler pointed out that the Old Man’s retirement scheme wasn’t polling too well at voice of the cabinet minister, things changed.

qotd2300nov20

From a little over 7200 votes on Saturday morning there were an astonishing 25,413 votes later on.  Suddenly 70% of the universe is loving the retirement idea.

Here’s what the results were at about 10:30 Saturday morning:

qotd20nov1030[4]

This is a just a reminder that someone in the province’s reform-based Conservative Party pays way to much attention to this sort of trivial stuff. 

No one has documented the whole foolish business as consistently as labradore.   In January 2008, for example, labradore noted the gigantic number of votes on question of the day polls that were important to the Premier (or mentioned him by name) versus some other topics.

In October 2009, he noted the same trend with the new VOCM website even though some technical changes made it harder for some dork to sit at a computer and mouse click his way to premature carpal tunnel all to make the Old Man look better.

Now that one is interesting because it makes it pretty clear that the vote total earlier on Saturday was actually higher than the average already.  The late night total was more in line with the ludicrous numbers from the old-style VOCM website.

Meeker on Media has also done a few posts on it.  One titled “Vote fixing” appeared in 2008.  It’s been re-dated as a result of the recent switch to a new layout at the Telegram website.

After Meeker blogged about one technique for rigging the poll, someone must have tried it.  The resulting click duel wound up crashing the VOCM poll system. Meeker’s comments at the time are worth repeating because they show a similar pattern of insane click counts as we’ve seen so far on November 20:

I saw some irony in the question. I also noticed that, at the time (about 12:30 pm), there were almost 2,000 votes at the site, with 63 per cent disagreeing.

My prediction was that, if the Yes votes made a sudden resurgence, the Trained Monkeys would immediately start clicking No and the voting numbers would go into the tens of thousands (they usually like to maintain a 70 per cent share of the vote).

And my prediction was correct. People did want to play this game. Within an hour, the number of votes had doubled, and the Yes side was out in front. At 2:30 pm, I had to go to a meeting, and at that point the Yes side was still leading, with 55 per cent of 10,000 votes cast.

That's right, ten thousand! It was wild.

When I got home later in the evening, the No side was winning. Votes at that point were around 25,000, and they were back around 60 per cent.

While I was talking live on the radio with Linda Swain, the number of votes was actually increasing by the thousand, as the minutes went by. The last tally I saw was 53,000 votes, with No holding at about 60 per cent.

This poll question will be up all weekend. It’s going to be fun watching to see what happens by Monday morning when the VOCM will likely change the question.

In the meantime, as you look at this an laugh, just recall that someone has obviously been organizing this intense idiocy for the past seven years. 

And then Danny Williams complains about what he could get done if he wasn’t distracted.  Well some of us have been saying that for years. 

When this sort of foolishness turns up again, you have to wonder how much could have been accomplished if all the rest of his Fan Club actually did real work instead of obsessing with this sort of trivia to the point they spend an unhealthy chunk of a November Saturday making sure VOCM  news told the right story in its QOTD report on Monday

sock puppet - wikipediaIncidentally, just for fun watch and see if the comments section of this post starts turning into a laundry basket full of Conservative sock puppets (right, not exactly as illustrated).

Odds are good it will happen just like they all turned up on the earlier one about poll goosing.

- srbp -

20 November 2010

Falling down on the job – Lower Churchill opinion

Not so very long ago, the Reform-based Conservative Party had an army who spent their time clicking madly to make that any question of the day on the VOCM website went the way the Premier would like.

It was all part of the machinery designed to maintain an illusion that the regime du jour is wildly popular. Incidentally, November is one of the four months of the year when the entire poll goosing apparatus usually goes into high gear.

How times have changed.

At 10:30 AM on Saturday, the VO question of the day results looked like this:

qotd20nov1030

Only one third of the respondents – out of a hefty 7207 - like the Premier’s Lower Churchill deal. Almost half did not like it and, curiously enough, another 21% were not sure about it.

Not sure?

Perhaps someone is falling down on the job.

- srbp -

23 August 2010

VOCM “news” has no source

News outlets usually give a source for the information they provide, so when the province’s largest commercial radio station gives a glowing story without a single source, one tends to get a wee bit suspicious.

And when the information contradicts reliable sources, you have to wonder what sort of shenanigans are going on over at the radio network known derisively at this time of the year as voice of the cabinet minister.

Here’s the entire “story” VOCM posted to its website under the headline “Construction Booming in Capital City”.

VOCM construction

The audio file attached to the story demonstrates the text is just the script for the report.  And if you can’t make out the print in that picture, here’s what it says:

If you're of the opinon [sic] there's more construction activity than usual going on in the capital city, you're right. Virtually all elements of the construction industry are up in St.John's. The only area which is experiencing a decrease for the year to date is residential, which is about $5 million off last year's pace. The number of units being built has dropped from 422 to 365. Commercial is going at nearly double last year's rate, industrial has gone from next to nothing to $300 million, and government or institutional type activity has soared from $20 million to $90 million. Overall, building and reno permits are worth about 60 per cent more this year than last August.

So where did all this information come from?

That’s a good question because there isn’t any clue anywhere in the audio version or in the text file as to where they got the information.

If you go to an authoritative source, like say Statistics Canada, the most recent figures don’t show anything vaguely like the VOCM claim. 

Here’s a chart of SC’s tally of non-residential building construction in the province as a whole and in St. John’s (the blue line with diamond-shaped bullets). The numbers on the vertical axis are millions of dollars. Your humble e-scribbler ran it in late July, so some of you will be familiar with it.

For the second quarter of 2010, the value of non-residential building construction  - that’s institutional (government), commercial and industrial for St. John’s was $40 million.

Not the $300 million claimed for the industrial component alone.

$40 million.

Total.

Even if you added up the two quarters, you still would be less than one third of the number VOCM claims without any sourcing for just one category and only in St. John’s.

Hey, VOCM.

Ed Murrow called.

He wants those awards back.

- srbp -

19 August 2010

The truth of fiction

nottawa does a fine job of laying out the completely ridiculous media coverage this week of a few words the Old Man had with Randy Simms on Open Line about online gambling.

There’s also a Telegram story that apparently took two people to pull together. it appears to be nothing more than the same rehash of Danny Williams’ call to Open Line just like all the others.

There are a couple of aspects to this that nottawa missed. 

First of all, Williams’ call came simply because we are in polling season.  Williams wanted to generate exactly this sort of coverage and the local media are all too happy to oblige him.

When cabinet finally gets around to dealing with this issue, it really won’t matter what Williams said publicly on this occasion. This won’t be the first time he or someone from his cabinet said one thing and did another.
That sort of thing is old hat.

Nor will the people of the province know until – potentially - two years from now that he said one thing and did another.  Ontario, for example, is getting a piece of the action.  The Ontario lottery commission will take 18 months to launch their project.  Even if the provincial cabinet here met as they used to on Thursday morning and blessed this proposal, there’d be no sign of it, necessarily, until well after the next election.

By then, any personal opposition Williams really has to the idea will be completely irrelevant.  Heck, even he won’t care what he said just this past week.  Williams will take a whole new position and never have to worry someone will point out that he used to say something else.  It’s like being a have province:  Good thing in November 2008;  bad thing, two months later.  Same reporters wrote both stories like the one didn’t contradict the other.

And that’s the second aspect to the online gambling unstory.

Online gambling is a serious enough issue but Williams’ statement that he opposes it is not news, especially when he says it is a cabinet decision.

His comments are certainly not news in comparison to the story last week when  he revealed a billion dollar secret energy deal.  To date not a single local media outlet has covered that aspect of the Nova Scotia transmission line story. Odds are that not a single reporter has asked Williams about it and if they have, we are unlikely to see a story saying that the administration is hiding information or is stonewalling.

The local newsrooms will oblige the Premier in what everyone now knows is a quarterly farce and yet they are ignoring a gigantic hard news story.  They are turning away from it – apparently – just like they ignored the Dunderdale story from around the same time last year. Oddly enough, she made her remarks to Randy Simms as well.

On the same show this morning, one regular caller repeated the same [old] myths, half-truths, distortions and fabrications on the same old subjects – all aligning with the frame the Premier set last week - as if any of his claims were real.

And the host agreed with it all.   In fact, Simms led off his show on Thursday with the Premier’s frame on the transmission line. He [even] added a few gems of his own.

As it seems, Newfoundland and Labrador is a place where not a single public figure is concerned with facts. 

None of them is concerned with reality.  Politics and the the news media is about fiction.

Sixty years ago, Walter Lippmann wrote that even in their lifetime the people he called great men are known to the ordinary citizen only through “a fictitious personality.”

Well, these days, the entire scope of public life in Newfoundland and Labrador is fiction.

- srbp -

Updated 1920 hrs to fix capitalisation, add words to correct flow in two sentences and delete the word “province” where it occurred in the wrong spot.