Showing posts with label polling. Show all posts

07 July 2012

The Happiness Index #nlpoli

Leave it to labradore to come up with a new way to look at poll results.

He took the results of “satisfaction” questions in polls going back about a decade.  he netted them out, meaning he subtracted the dis-satisfieds from the satisfieds.

What he got is very interesting.

06 July 2012

More Hole Spotting #nlpoli

After the shock that evidently settled into the local Tories, the next most obvious thing about Thursday was the complete absence of any official provincial Tory anywhere saying anything about anything.  The usual clan of Tory Twitter Spam Spitters – Sandy Collins, Steve Kent, Vaughan Granter, and Paul lane  - were nowhere to be seen.

Normally these guys are everywhere spewing whatever bullshit talking point they have to spew.

Thursday?

Crickets.

or was it knobby knees knocking?

05 July 2012

Hole-spotting: the Environics Poll Results #nlpoli

By now you have likely heard it all.

remaincalm-01In one corner are the raft of people trying to dismiss the Environics poll as an outlier, an aberration, the logical result of a tough political month. 

Nothing to sweat.

Real Chip Diller kinda stuff.

In the other corner, there are the New Democrats who are so effercited they are like the dog who caught the car.

Well, here’s another take for you.

04 July 2012

Environics latest national poll #nlpoli

As the country comes out of the long-weekend stupor, a few people noticed a poll released on June 29 by Environics.  Nationally, it shows a very small lead for the New Democrats over the Conservatives. That’s a modest change from May when the Tories were slightly in front of the New Democrats.

What caught some local Twitter attention was the post by threehundredeight.com and the headline “Majority support for federal NDP in Newfoundland & Labrador?”

The question mark is there for a reason, as you will see in a moment.

11 June 2012

Seat Counts and seats count #nlpoli

Last Friday, your humble e-scribbler gazed into the old crystal ball and produced a possible poll result if the recent trends continued.

If you reported them the way Corporate Research Associates does, you’d get the Tories at 42%, NDP at 38% and Liberals at 20%.

Wonder what that might mean to seat counts if you had that as an election result?

08 June 2012

Describing the hole #nlpoli

“Premier Dunderdale has the highest personal popularity of all Atlantic Canadian Premiers” the Tory faithful tweeted and retweeted on Thursday night to help ward off the chill of recent polls.  It was the 21st century equivalent of clicking their ruby slippers together and whispering that there was no place like home.

Sadly for the darlings, they did not have Toto and this is not Kansas, anyway. 

The toll the Tories mentioned came from Angus-Reid. In it, 46% of Newfoundlanders and Labradorians approved of Kathy Dunderdale’s performance while 44% disapproved. She may score the highest of the Atlantic Premiers but with the population evenly divided on her, she is not doing all that well.  As your humble e-scribbler reminded them, what they were really saying is that their hero du jour just didn’t suck as much as Darrell Dexter. Big deal.

07 June 2012

Would you buy a hydro dam from these people? #nlpoli

Anyone who was wondering why the Tories ramped up the attacks on the NDP this week can now find the answer. The clue to the future is that the Tory attacks were pathetically weak and ineffective. Rather than deliver a killer virus, all the Tories did was help the NDP build up their immune system.

Bad move.

The news:  the provincial Conservatives had the support of 34% of respondents in the last Corporate Research Associates poll, about 11 percentage points ahead of the provincial New Democrats.

These are numbers you get if you take out the CRA skew of talking only about decideds.  Here’s a picture of the party choice numbers, including the undecideds since last year, just so we are all on the same page.

CRA 0512

That black line is the undecideds.

Now here’s what it all means.

06 June 2012

Poll math refresher #nlpoli

In advance of the latest Corporate Research Associates poll, check out the SRBP post on the February results.

Here’s the Tory voter choice number, over time, compared to actual vote results in 2003 and 2007 and in 2011.

CRA Q1-12[4]


-srbp-

15 May 2012

Don’t remind her, Tommy #nlpoli

The townie Tories are all a-twitter over federal Dipper leader Thomas Mulcair’s endorsement of Sheilagh O’Leary for mayor of Sin Jawns in the next municipal election.

On Monday, reporters asked Premier Kathy Dunderdale about Mulcair’s comments.  Here’s a bit of what she said, via CBC:

"I don't know how somebody who doesn't live here, is not on the ground, doesn't appreciate the demographics to start with and the particular issues, could be offering advice on who is best suited," said Dunderdale outside the House of Assembly Monday. [capitalization corrected]

“So the frig what?” would seem like a better, i.e. appropriately dismissive, response.  Instead Kath used a comment that begs for the retort that she does it all time:  talks about stuff when she doesn’t “appreciate the demographics” or understand what is going on.

27 March 2012

Tory and Dipper leader in approvals tie in NL: poll #nlpoli

An unspecified number of people polled online in Newfoundland and Labrador by Angus-Reid approved almost equally of the job done by e Premier Kathy Dunderdale and New Democratic party leader Lorraine Michael.

The margin of error for the entire poll of more than 6,600 Canadians in nine province is given as plus or minus 1.2%.  There’s no indication of the margin of error for Newfoundland and Labrador.

What’s most interesting though is the matched approval ratings.  More respondents disapproved of Dunderdale than Michael but more respondents were not sure of their opinion of Michael compared to Michael.

Approve

Disapprove

Not sure


Kathy Dunderdale

55

37

8


Lorraine Michael


55


32


13

Respondents were asked:

Do you approve or disapprove of the performance of each of the following people?

Dunderdale’s approval is down five percentage points from December 2011 and three points from August 2011.

That gets more interesting when you compare Dunderdale over a longer period.  For example, 35% of respondents were not sure about her in February 2011, the highest undecided result for any Premier in the survey.

One year later and those undecideds have moved to the “disapprove” column.  Her “approved” rating is at 55% in 2012 compared to 55%* a year ago.

Here’s how things looked last summer:

According to the latest Angus-Reid poll,  43% of respondents are satisfied with Kathy Dunderdale’s performance as premier down from 55% in February and 67% for her predecessor last November.

Undecided remains at 35% of those polled.

But here’s the thing:  Those who said they were dissatisfied with Dunderdale’s performance went from 10% in February to 23%.

Kathy Dunderdale may be Premier but that doesn’t mean she doesn’t have some serious political problems to deal with.

- srbp -

*corrected number

12 March 2012

Poll Math #nlpoli

Just for the heck of it, here’s the most recent CRA marketing poll adjusted to take out the misleading way CRA reports its clients poll numbers.

Here are the Conservative Party voter choice results from the fall of 2010 when Kathy Dunderdale took over the Tory leadership until the most recent poll in February.

CRA Q1-12

The solid blue line is the percentage of respondents who picked Conservative.  It’s the real percentage, not the share of “decideds”.

The light blue dashed line is the actual percentage of eligible votes the Tories got in 2003 and 2007.  Yes, friends, 43% of those eligible to vote picked Tory.

The bottom line is the share of eligible votes the Dunderdale Tories got last October.  If you can’t quite pick it out, the number is 32%. It’s the lowest share of eligible vote any Tory government received and won re-election to government.  The previous record low was 33% in 1975

So while there’s nothing in these numbers that would send the Tories into a panic, the fact is that the Tories don’t have the kind of overwhelming electoral support that would allow them to do things like…say… slash public spending without risking a pretty significant turn around in popular support. 

Keep that in mind over the next few weeks.

You see while the Tories might be 20 points ahead of their nearest rival according to CRA, that really means that only an 11 percentage point swing puts the Tories in second place, behind the New Democrats.  Even a five point swing to the NDP would send shock waves through provincial politics.

Heck, if the Tories drop down in the public polling to numbers below 50% in the misleading way CRA reports them and you’d see people raise their eyebrows.

Slow down government spending to any great degree, chill economy with talk of lay-offs or – to be really daring – actually lay people off and you can bet there’ll be a change in the polling numbers.

It’s important to keep these things in perspective.

- srbp -

07 December 2011

Margin of error defined #nlpoli

Corporate Research Associates November 2011 omnibus:

If a provincial election were held today in Newfoundland and Labrador, for which party would you vote?

Progressive Conservative Party  60%

CRA August 2011 omnibus:

If a provincial election were held today in Newfoundland and Labrador, for which party would you vote?

Progressive Conservative Party 54%

Provincial General Election, October 2011:

Progressive Conservative Party:  32%

- srbp -

26 October 2011

The Insiders on Polls during Elections #nlpoli

Just when you thought it was safe to stick your head up now that the poll-talk was gone, along comes three party insiders talking to Peter Mansbridge about polls.

Take the time to watch this video. The front segment on polls is short. You will learn a lot about how political strategists use their own polls to drive campaign decision-making.

And you’ll also hear a pretty frank and largely dismissive discussion about the polls you read in the media.  Most of that discussion will sound very familiar to you. 

The simple answer as to why the public polls are so spectacularly wrong is, as David Herle notes, that the public polls don’t look at voters.  They are actually looking at the population as a whole and with turn-outs dropping, those polls just don’t do a very good job at picking up on opinion in a progressively smaller bit of the electorate.

People lie to pollsters.  What a shock.  People lied to pollsters regularly and quite openly in the polls in this province during the recent general election. 

The pollsters won’t talk about that or their abysmal accuracy because the polls they release are marketing tools.  The media won’t talk about the wildly inaccurate polls because they are marketing tools for them as well.

Kathleen Monk adds a nice bit of colour on how the NDP used polling to determine the emphasis they placed on Jack during the last campaign compared to anything else.

And Jaime Watt adds the fine touch of noting that party people use a bunch of different information – he calls them data points – to figure out what is happening with the campaign.  Polling is one thing.  Canvassing is another and cash flow from donations is yet another of several points.

That last one will tell you why the spreadsheeters like threehundredeight.com go off in the trees.  Not only are they relying on inherently faulty data – those inaccurate public polls – but they rely on basically one type of data to try and forecast how seats were going.

Just to give you a sense of how inadequate that approach can be, realise that your humble e-scribbler chewed over with a colleague used a variation on the poll analysis approach. It turned up some curious things as the polls flowed in the last provincial election.  As the NDP numbers grew and the Tories dropped,  a bunch of seats showed as coming into play.

St. John’s Centre and East would look like they were swinging.

But so too did Virginia Waters.

And Bellevue.

And the Isles of Notre Dame.

The only way you’d cross those off the list of seats that might actually swing is by pulling in other sources of information.  The Straits never showed up on the chart and, frankly, without any signs of anything from that one seat, no one likely saw the change to the NDP coming.

For what it’s worth, your humble e–scribbler’s sister dazzled some of her townie Tory friends by naming seats in Sin Jawns that definitely flipped to the NDP. She never told them where she got the information but it came from an analysis of the polls and other tidbits.

You work with what you’ve got, even if it some of it is inaccurate, but with enough data points you can still build a pretty reliable picture of what’s going on.

The townies never saw  the changes coming largely because the media never reported any of the battle.  But after the votes were counted, her friends figured she was some sort of magician or witch.  A little information can make a lot of difference.

- srbp -


.

20 October 2011

PPM: Controversy, Accountability and Disclosure #nlpoli

On October 3, Liberal leader Kevin Aylward issued a news release in which he claimed that the second MQO poll released the Friday before had been “bought and paid for by the Tories.”

In the release, the Liberals also claimed that “[t]he Dunderdale Government has bought and paid for this online survey.” 

The Liberals had no evidence to back their claims that the poll was fabricated.  They offered no evidence to refute the polls findings.

In 1989, faced with a partisan poll scam, the Liberal campaigned released its own internal data that proved to be far more accurate than the one released by the Conservatives’ pollster.

In 2011, the Liberals didn’t have polls, let alone ones that could give numbers different from the ones MQO produced.  The release served only to keep alive a bad news poll for the Liberals for the third week of the campaign. The release looked much like a desperate effort by a disorganized campaign fumbling about for anything that could stave off collapse.  The release reeked of desperation.

That desperation became all too apparent as NTV, Environics and then CRA polls appeared all conducted around the same time as the MQO one and all showing numbers that showed the Liberals in more or less the same place as MQO.

Industry controversy, too

After the campaign, CRA president Don Mills complained publicly about campaign poll reporting.  The Telegram quoted Mills:
“There’s a lot of people who say online research is just as good as telephone research. That has not been proven to be true and we have recent examples in Atlantic Canada where a competitor of ours has used an online methodology and have not got it within the margin of error they quoted” he said.
Of course, Mills’ poll didn’t come any closer, but his comments did point to problems with the publicly released polls.

Industry Standards

The Market Research and Intelligence Association represents Canadian market research and public opinion firms.  MRIA has established standards for the public release of polls by firms.  The standards include these provisions:
1) Please include the following key facts in the report:
  • Sample size, and population surveyed (who was included)
  • Sponsor of study (who commissioned the research)
  • Survey method (e.g. telephone, on-line, intercept)
  • Timing (when the survey was done)
  • Statement of sample error/margin of error (i.e. "+/- 2.5% 19 times out of 20")
2) Please make the following facts available to the public upon request (if not included in report):
  • Name of practitioner (company conducting research)
  • Sampling method (e.g. random, custom list)
  • Weighting procedures (statistical weights, if used)
  • Exact wording and order of questions
3) Always differentiate between scientific (most public opinion polls) and non-scientific studies (reader/viewer polls or other "self-selection" methodologies). 
4) Where appropriate, use the caveat that research is not necessarily predictive of future outcomes, but rather captures opinion at one point in time.
What’s the problem?

Both the Aylward and Mills criticisms are rooted in one problem:  a lack of disclosure of details of the polling not just by MQO but of all the firms that released polling during the election.

MQO only confirmed its research was done independently of its clients once Aylward raised the issue.  But even for the sake of its own public image, MQO‘s two releases didn’t offer a great deal of information that would have avoided that controversy or the issue Mills raised.

How do the firms stack up?

A simple reading of the first MQO release suggests that it meet those MRIA standards exactly, as limited as they are, with respect to what must be included: 
The poll was based on a sample of 413 Newfoundlanders and Labradorians, with a margin of error of +/- 4.9%.  It was conducted between Friday, September 16 and Sunday September 18, 2011.
The release did not indicate the type of survey (telephone, online etc).  It did identify the company that conducted the work  - part of the “on request” information but didn’t release any of the other information in the same section.

If this release complied with the MRIA standard, the poll was a sample of all people in the province regardless of whether they could vote or not (“Newfoundlanders and Labradorians”). That would make it difficult to compare the poll to any others or even to the voting population as a whole.

There’s no indication of how MQO selected the sample, either.  Was it a randomly selected sample or was it something else?

The second MQO disclosed some additional information but that just raised questions about whether or not the second poll could be  compared to the first:
The poll was based on a sample of 464 residents of Newfoundland and Labrador, with a margin of error of +/- 4.6 per cent. The research was conducted via phone and online between Wednesday, September 28 and Friday, September 30, 2011, using MQO’s research panel iView Atlantic. The sample was weighted regionally to ensure proper representation of the province as a whole.
Again, the sample appears to have been drawn from people resident in the province, regardless of age.  The second release includes information on how MQO collected the data – “via phone and online” – but it isn’t clear how the sample was selected if MQO a previously screened research panel.

The other firms aren’t necessarily any better, though. Consider how Canadian Press described the Environics poll:
Unlike traditional telephone polling, in which respondents are randomly selected, the Environics survey was conducted online from Sept. 29 to Oct. 4 among 708 respondents, all of whom were chosen from a larger pool of people who were recruited and compensated for participating. Environics then adjusts the sample to reflect a broad spectrum of the population.
The non-random nature of online polling makes it impossible to determine statistically how accurately the results reflect the opinions of the population at large.
More information in many respects right down to the fact that participants in the panel were recruited and paid for participating. And to be fair to Environics, this is the CP version, not necessarily the exact description the polling firm gave of its sample and population (who they were studying).

And then there’s how CRA typically describes its quarterly omnibus:
These results are part of the CRA Atlantic Quarterly®, an independent survey of Atlantic Canadians, and are based on a sample of 400 adult Newfoundland and Labrador residents.  The survey was conducted from August 15 to August 31, 2011 with overall results for the province accurate to within + 4.9 percentage points in 95 out of 100 samples.
Some information is missing – presumably it was a random sample – but CRA appends to the release a table of data, the wording of questions and comparative data for several previous polls.

Even with industry standards and even considering the firms involved  are all MRIA members – MQO and CRA are Gold Standard members – the polling firms don’t follow the same practices in how they report polling information. 

Why Disclosure is Important

For those who might think Mills’ criticism about the online panel are accurate, check Geoff Meeker’s post on the controversy.   Meeker put the question of the panel to MQO and got a written reply.  Included was this description of the panel composition that – from MQO’s standpoint – justified including a margin of error while Environics did not:
iView Atlantic is a probability-based panel, meaning that every member of the population has an equal chance of being selected for participation.
These are not esoteric issues.  The MRIA news release accompanying the disclosure standards included these comments by the past president of MRIA’s predecessor organization:
"All of these reporting items create transparency in the polling process and help the public establish an informed opinion about the results of a poll…If we want people to take part in the democratic process, we must be certain they have confidence in the way we conduct our business, from the time they answer our questions through to the results being published."
Ensuring public awareness of opinion research techniques and issues also fulfills objectives set out in the MRIA Code of Conduct. Members of the public should be able to have complete confidence in the poll results they see as well as in their ability to compare results from different research methods.

Given both the controversy in the recent election and the variation in the amount of information polling firms released – even with established standards -  the MRIA has some work to do.

The American Example

With a larger polling industry, more election polling and a much wider experience with controversy, the American polling industry has much more stringent disclosure standards than those of MRIA. None of the polls released during the Newfoundland and Labrador election came even close to the American standards. 

Few Canadian polling firms typically come close to the American standards, but then again, the local controversy is merely one part of a much larger issue in the Canadian industry.  Perhaps it is time for MRIA and its members to review their existing standards with an eye to making them more prescriptive.

The American Association of Public Opinion Research also promotes education for journalists on polls and polling in order to improve knowledge of industry standards and practices. AAPOR has also developed an online course for journalists run in co-operation with  the Poynter Institute.

The National Council on Public Polls has also compiled a list of 20 questions journalists should ask about polls.  The information contained in the questions and answers includes plain language discussions of margins of error and sources of error.

- srbp -

19 October 2011

PPM: The Polls and the Local Media #nlpoli

All daily media in the province reported polls released by polling firms during the 2011 general election

They reported the polls as the firms released them.  That is, they did not question or alter the presentation of the numbers, nor did they discuss the different methodology used to generate them. This CBC report is typical.

The second MQO poll, released on September 30 stands out in particular as a result of the way it was reported.  This poll prompted a news release from Liberal leader Kevin Aylward that we’ll discuss in greater detail in the final segment of this series.

What’s most interesting about the second MQO poll is the way the firm reported the results for a question it asked on the leaders’ debate. 

One can make a theoretical argument about eliminating undecideds in the presentation of a party choice question. Some pollsters would claim this would allow you to match their poll result with the popular vote on election day.

But there’s no reason to alter the presentation of the results in such a way for any other sort of question.  Yet that is exactly what MQO did with the leaders’ debate question.  For some inexplicable reason, MQO reported the results in such a way that they placed the emphasis on those who watched the debate.  They then presented their responses as if those who reportedly watched the debate was 100% of the sample.

When asked about the leaders’ debate, 34 per cent of those polled said they watched the televised leaders’ debate on Wednesday, September 28. Of those respondents who watched the debate, 36 per cent felt Kathy Dunderdale won the debate, while Lorraine Michael was seen as the winner by 22 per cent, and six per cent said Kevin Aylward came out on top. The remainder of respondents said there was no clear winner of the debate.

The result was this sort of presentation in news stories:

The poll poses serious questions for Kevin Aylward and the Liberals who have been struggling through the campaign with an accumulated debt and difficulty with recruiting candidates.

Of respondents who had watched the leaders' debate on Wednesday night, only six per cent said Aylward won it. By contrast, 36 per cent chose PC Leader Kathy Dunderdale and 22 per cent chose NDP Leader Lorraine Michael.

"The remainder of respondents said there was no clear winner of the debate," MQO said in a statement.

In the rush to write a news story, no reporters caught that 66% of the respondents didn’t watch the debate.  They didn’t adjust the rest of MQO’s numbers accordingly. The result is that MQO’s misleading presentation of its results survived into news casts.

Aside from the MQO and Environics polls released by the companies themselves to all media, two of the province’s major media outlets commissioned polls for the 2011 election.

NTV commissioned their usual pollster, Telelink, to conduct a poll similar to ones they have done with Telelink on several occasions over the past six years.

The poll served the usual purpose.  It gave NTV exclusive news content as well as a marketing opportunity.  NTV was also able to ask a question on Muskrat falls similar to one from an NTV/Telelink poll in February.  As such, NTV was able to describe not only the results of the new poll but the trend – in this case a decline in support – from the earlier poll.

The Telegram commissioned CRA to conduct a poll with what turned out to be the largest sample of any poll conducted during the election. 

Consistent with experience elsewhere, the Telegram used the poll to generate large amounts of original content in addition to reaction pieces.  The poll was the centrepiece of the paper’s election coverage over three days, beginning on October 6. 

The poll, however, did not add significant new information to any other poll results.  The Saturday edition  - October 8 - featured responses to questions on the so-called rural-urban divide.  However, the questions – which party do you think best deals with rural issues and so on – basically mirrored the satisfaction questions without adding significant depth or colour to public understanding of the issues and public opinion. “Satisfaction” questions ask respondents to indicate how satisfied they are with government performance on a given topic. 

The Saturday edition of the Telegram also reported on another key question.  The Telegram asked respondents which party they would chose if Danny Williams was still the Tory leader.

Curiously,  the Telegram found that health care was overwhelmingly the major issue for respondents, just as CRA polls for the provincial government reported for the past year.  However, the Telegram did not probe any dimensions of that opinion.  What is it about health care that people are so concerned about?

The most significant aspect of the media and polls during the 2011 election was not what the media reported of specific polls during the election.   Rather it was the conclusion that news media drew from the CRA quarterly omnibus results and then the subsequent polls.

The Tories were assured of a massive majority, so the interpretation went.  The only thing potentially worth watching was a race for second place in poll results.

You can see the theme in national media – CTV or the Globe for example – and you can also see it in local coverage.  The CBC interpreted the second MQO poll with a particularly strident emphasis on the supposed loss of ground by the Liberals in the poll.  The decline, incidentally, was well within the margin of error.  The CBC characterised the change in numbers as “freefall.”

What this interpretation missed as a result was the dramatic battle between the New Democrats and the Conservatives in St. John’s.  No daily media in the province reported it before the election results on October 11.  In the October 8 edition, for example, the Telegram election coverage made no mention of the battle beyond the NDP confidence in seats changing hands. 

If they missed entirely a pitched battle right under their noses, it is no surprise that they also missed the Liberal campaigns in western Newfoundland that resulted in the party winning enough seats to continue as the official opposition in the House of Assembly.  The Liberals, as one wag noted, refused to follow the media script and die on cue.

By following the polls – marketing devices for the polling firms and for some news outlets – the news media missed the news in the local election.

- srbp -


18 October 2011

Handling the Undecideds #nlpoli

Opinion polls conducted in Newfoundland and Labrador that ask about party choice measure the opinion of the entire population of eligible voters.

As such, discarding the undecided responses (anything other than a party choice) or reallocating the undecideds according to some pre-determined policy tends to distort the poll results. It doesn’t matter whether the question is about a theoretical election “tomorrow” or one that will actually occur two or three weeks in the future.

What to do with the undecideds is a contentious issue among pollsters themselves.  The technique CRA or MQO used in their election poll reports has the effect of allocating the self-identified undecideds according to the same breakdown as those already decided.

But the experts at pollster.com, for example, will insist that late undecideds tend to break for the challenger.  That’s the opposite of what MQO and CRA do.

Other pollsters handle the undecideds differently.  As Mark Blumenthal noted in a 2004 post, the Pew Institute and Gallup sometimes allocate undecideds evenly among the other choices.

What’s interesting to note, though, is that the undecideds in the American poll results tend to be less than 10% of respondents.  The decideds comprise two choices each of which is four or five times larger.  Reallocating that small a percentage or discarding it entirely does not necessarily skew the picture of public opinion that greatly.

In the recent provincial general election, MQO reported the lowest level of undecideds in its polling at 18% for its second poll and 20% for the first one. But at least one of these was not the traditional random sample pollsters historically use.

The “undecided” category appears to capture those who said they were undecided, those who said they did not intend to vote and those who refused to answer the question.

In telephone polls during the election that apparently used random samples – Telelink and CRA -  the lowest reported undecided/will vote/ refused was 26% for CRA in both its poll for the Telegram and its August quarterly omnibus.

Telelink hit 42%. 

Environics had an undecided of 30% using its online panel survey method.

With undecideds at those levels, reallocating them can significantly distort the perception of what opinion the public actually holds.

This is no small point when the polls are apparently intended to describe the opinions held by all adults over the age of 18 years not just those who may – from election to election – decide to go to the polls.

In the most recent general election, the percentage of eligible voters who didn’t go to the polls was larger than the percentage that supported the winning party.

You can see the effect of the distorting effect when you compare the poll results to the actual vote result as a share of eligible voters. All the results cited below were conducted between September 30 and October 3. 


Vote

CRA

ENV

MQO

NTV

PC

32

44

38

44

35

ND

11

18

22

27

15

LIB

14

12

09

11

08

DNV

42

26

30

18

42

The distortion can then lead people to draw some erroneous conclusions.  Take, for argument sake, the Telegram editorial on October 17:

Cheers: to more fun with numbers. The provincial Liberal party has made much hay with claims that by landing six seats and staying as the provincial opposition, it was somehow proving pre-election critics wrong. (The claims, of course, ignore the fact the party had the lowest share of the popular vote in its history.)

Numbers can be lots of fun, if you understand what they mean.  Election results in a first-past-the-post system depend very much on what party can get its voters to the polls in each district.  Even with overwhelming voter support – according to the distorted presentation of poll results that discount UND/will not vote – the Tories should have easily swept every district.

But they didn’t.

They lost seats.

The Tories lost seats in their heartland of St. John’s and came close to losing a bunch of others.

When voter turn-out drops, as in the election just finished, the actual share of eligible vote becomes more important.  The Telegram editorial ignores the fact that turn-out in the most recent election hit a historic low.  If voter choices had actually looked like the numbers their pollster claimed he reported, the whole election would have turned out differently!

But  - for some reason - their pollster missed a huge chunk of public opinion.  He wasn’t alone.  Only NTV/Telelink hit the number, even if it wound up being mislabelled.

In the end:

a poll released near to an election with a relatively high number of undecided voters is an indication that the questionnaire was not designed properly, and/or that the screening of voters was not conducted with enough rigor. Well-designed screening questions and well-written “who will you vote for questions” should, as a natural byproduct, produce lower undecideds in a final pre-election poll, all other things being equal. The solution is not, as some have recommended, for the pollster to make up numbers on election eve for the purpose of eliminating the undecideds, but rather to craft the survey instrument in such a way that it naturally results in fewer and fewer undecideds as the election draws near.

- srbp -


  • Monday:  “Politics, Polls and the News Media”

  • Tuesday:  “PPM:  The Polls in the 2011 Election”

  • Wednesday:  “PPM:  The Polls and the Local Media”

  • Thursday:  “PPM:  Controversy, Accountability and Disclosure”

PPM: The Polls in the 2011 Election #nlpoli

Polling firms released more election polls in the 2011 provincial general election than in any recent provincial election.

Corporate Research Associates, Environics, MQO (MarketQuest Omnifacts) and Telelink produced a total of five polls.  MQO issued two polls 10 days apart.  Telelink and CRA produced polls for NTV and the Telegram, respectively and Environics issued a single poll.

The Polls and What They Reported

News stories reported what the polling organizations reported to them.

MQO issued its first poll on September 20, one day after the campaign formally started.

They reported the responses to questions on  party choice (“if an election were held today”), leader choice, government satisfaction and top issue.  The news release gave the results for party choice and leader choice as percentage of decideds, but with the percentage undecided  - described as “noncommittal” in the leader choice paragraph – included.

The poll was based on a sample of 413 Newfoundlanders and Labradorians, with a margin of error of +/- 4.9%.  It was conducted between Friday, September 16 and Sunday September 18, 2011.

Aside from the news release, MQO apparently did not release anything else about the poll including information on how the sample was chosen, any weighting, if the poll was done alone or as part of a larger poll or details of question wording and order.

MQO issued its second poll release on September 30.

The release reported on questions on party choice, leaders’ debate,  government satisfaction and major issue. As with the earlier release, the results for the party choice and leader questions gave results as a percentage of decided respondents and included the percentage undecided.

The poll was based on a sample of 464 residents of Newfoundland and Labrador, with a margin of error of +/- 4.6 per cent. The research was conducted via phone and online between Wednesday, September 28 and Friday, September 30, 2011, using MQO’s research panel iView Atlantic. The sample was weighted regionally to ensure proper representation of the province as a whole.

The release did not include information on the research panel or how MQO combined the panel sample with the telephone.  The release only indicated the sample was weighted regionally but gave no indication of what standard was used to determine the appropriate weighting.

The release did not give any information on question wording, order or other information related to how the poll was conducted. The two releases do not indicate if MQO conducted both polls using the same methodology such that the results could be compared.

This release included two graphics showing some of the responses for the leader choice and party choice questions.

On October 3, NTV reported a poll it commissioned from Telelink. NTV reported on party choice and leader choice.  Telelink conducted the poll on October 1 and 2, with a sample comprising 511 residents of the province. Reported margin of error was plus or minus 4.3 percentage points.

NTV reported the results for the party choice question (how the respondent intended to vote) as a percentage of all respondents, including don’t know, no answer.

Telelink probed the undecided/refused and produced a second set of party choice numbers combining decided plus leaning.

On October 4,  NTV reported on a question on Muskrat Falls following up on an earlier Telelink poll it had commissioned in February.

Environics issued a poll result on October 5 through Canadian Press.

Thirty-eight per cent of respondents backed the incumbent Progressive Conservatives, compared to 23 per cent for the NDP and nine per cent for the Liberals.

Thirty per cent were undecided.

The online poll was conducted by Environics Research Group and provided exclusively to The Canadian Press.

Unlike traditional telephone polling, in which respondents are randomly selected, the Environics survey was conducted online from Sept. 29 to Oct. 4 among 708 people.

The respondents were chosen from a larger pool of people who were recruited and compensated for participating.

The non-random nature of online polling makes it impossible to determine the statistical accuracy of how the poll reflects the opinions of the general population.

Neither Environics or Canadian Press released any other information on the poll.

The Telegram commissioned Corporate Research Associates to conduct a poll exclusively for the newspaper. 

The Telegram will roll out results of the wide-ranging poll — which has a large sample size of 800 — in the coming days.

The poll was conducted between Sept. 29 and Oct. 3 and has a margin of error of plus or minus 3.5 percentage points with a confidence level of 95 per cent.

The Telegram reported results of the poll from October 6 to October 8 for questions on major issue, party choice, second choice, leader choice and government satisfaction. 

The October 6 edition reported the party choice question as percentages of all respondents.  The Telegram reported on regional results for some questions but did not indicate separate margins of error for the regional results. CRA poll reports obtained from the provincial government under access to information laws typically do not show margins of error for these sub-sample breakouts.

The Telegram did not release any other details on the poll including specific wording of questions, sequencing or weighting. 

What the Party Choice Question Measured

The party choice question is the one question asked by pollsters for which a genuinely objective confirmation exists.

The problem comes, however, in determining what the pollsters intended to measure when they posed the party choice question.  There is what may be called a standard question – “if an election were held tomorrow…” however at least one of the polls involved a non-standard question along the lines of “who will you vote for next week?”

Some of the polls apparently asked non-standard questions

None of the news releases or news stories indicated what the poll results for the party choice question would show.  That is, one can read the releases or news stories and not see clearly that the numbers were intended to show a party share of vote on election day.

Some pollsters, such as CRA, report results that discard all undecided responses and treat the specific party choices as if they were 100% of the responses.

The Telegram story on October 6 included figures reported that way at the end of the front page story:

Among decided voters across all regions, 59 per cent of them said they would vote PC,  25 per cent NDP and 16 per cent Liberal.

It also included the results of a proving question for the undecideds/refused (26-27%) of respondents.

Among the undecideds or those who refused to state their preference, 26 per cent are leaning towards the PCs, while 21 per cent are leaning towards the NDP and 14 towards the Liberals.

Some 38 per cent said they don’t know.

The Telegram did not report its own results for decided + leaners

Based strictly on the limited information provided in the news stories and/or news releases during the campaign, it is impossible to say for certain what the pollsters intended to measure.  As such it becomes very difficult to compare the polls – as reported – for accuracy and consistency.

Take, for example, the CRA report for the Telegram.  According to the newspaper account, they have three separate potential sets of figures in response to the single party choice question.  There is the raw percentages reported on the front page of the Thursday edition (PC = 44%, for example)  Then there is the decideds-only reported in the third last paragraph of the story. (PC= 59%) 

And then there would be the possible decided plus leaning response.  To figure this one out, you’d have to do some math to calculate what 26% of 26% is.  That’s the number of leaners within the undecided/don’t know/refused from the first set of percentages.  Do the math, though and you’d get 44% + 7% = 51%.

But what are these numbers supposed to represent? 

There’s the rub.

Based on information SRBP obtained several years ago, it appears that none of the polling firms screens respondents to exclude non-voters. They do not identify voters, specifically.  Pollsters in Newfoundland and Labrador simply poll a sample of those eligible to vote. 

That means that the correct comparison for their polling numbers is not the share of people who show up and vote on polling day but a comparison with the entire population of eligible voters.

You can see this in the CRA question reported by the Telegram on October 6.  The initial question asked respondents which party the respondent was most likely to vote for. If CRA had screened out non-voters, none of the replies should have been “I won’t vote” .  But, in fact, 3% indicated they did not plan to vote.

The same is basically true of all the poll results, to one degree or another.  They measure party choice by eligible voters.  In the process, they capture  - or are supposed to capture -  people who are genuinely undecided, people who claim to be undecided and those who will not vote.

All are important in presenting a clear picture of public opinion as it actually was at the time the poll was taken.

Anything else is a distortion.

- srbp -

17 October 2011

Politics, polls and news media #nlpoli

For the past 65 years,  public opinion polls have been an integral feature of news media reports on politics and elections.

The reasons are pretty simple to understand.  Most public opinion polls are conducted by professional firms using scientific methods.  As such, they are considered to be inherently impartial, accurate and fair representations of what the public thinks about candidates and parties. 

The firms that poll during an election are usually independent of the political parties.  This gives the news media a source of independent information about the campaign.  Polls, especially ones exclusive to the news organization, can give the media outlets a direction for coverage.

When news media commission polls, they also gain a marketing boost.  Don’t discount the business imperative in news.  Tom Rosenstiel is executive director of the Pew Research Center’s Project for Excellence in Journalism.  Rosenstiel began a 2005 article on political polling and news media by recounting a meeting at the Los Angeles Times in 1991 to plan coverage of the 1992 election.

“Polls are a form of marketing for news organizations,”  Rosenstiel wrote. “Every time a Los Angeles Times poll is referred to in other media, the paper is getting invaluable positive marketing for its name and credibility.”

Presenting information in an entertaining way has always been a part of news. Poll results typically come in a form that lends itself to an horse-race story format.  That injects some energy into what might otherwise be a dull story of numbers.  .

Reporters usually have an easy time summing up a poll report.  That’s an increasingly important factor in newsrooms operating on tight budgets and facing heavy demands for content.

Rosenstiel marked that pressure in 2005 as a key feature of modern newsrooms.  But in truth, the need to produce news stories quickly has always been a feature of news media for some time now, especially electronic media. Political scientist Everett Carl Ladd wrote in 1980:

For the most part, the press… must work quickly to do its mandated job.  This observation obviously applies a somewhat less to magazines than to the daily newspaper or the nightly television news broadcast, but it holds generally. The story must be promptly brought to the audience.

What’s changed more recently is the increased demand for content as smaller numbers of news organizations produce material for print, radio, television and the Internet, sometimes from the same newsroom.  Often this is simply the repackaging of material, as Rosenthiel noted.  And that makes apparently simple stuff – like reporting a horserace poll – that much more attractive.  if the news organization commissions a poll of its own and delves into more than just the “who’s on first” question, they can generate new content for days.

Controversy

None of the media’s use of polls is has come without controversy. 

In the run-up to the spring general election, the seemingly wide variation in poll results generated news stories about the reliability of polling.

At a conference on the May federal election, people representing eight polling firms debated the impact of polls on the election.  Opinions varied – as they did – on what impact poll reporting had on the public.  According to a Canadian Press story, Frank Graves of Ekos Research said that post-election polling found that Canadians didn’t believe poll reporting affected the outcome of the election

Environics' Kevin Neuman was doubtful.

"People may say that (polls) don't influence, but it would influence the media and how the media cover the story and frame the story," he said, adding that the CROP poll "may have completely changed the media coverage."

In the recent Ontario general election, some pollsters complained about the publication of polls from different sources, often without any apparent concern for their accuracy.

“We are distorting our democracy, confusing voters and destroying what should be a source of truth in election campaigns — the unbiased, truly scientific public-opinion polls,” wrote Darrell Bricker and John Wright of Ipsos Reid.

Bricker said most research firms are accurate. But some are “so ridiculously inaccurate” he wonders how they got into the business. And elections bring out the carpetbaggers or those trying out untested, and dubious, methodology.

Still, the biggest question for him is not research firms. “I have to ask the question, what are the media thinking?

Closer to home, Corporate Research Associates’ Don Mills complained in the Telegram on Saturday about the accuracy of some polling released during the recent provincial election campaign. MQO released two polls during the campaign that relied on a combination of telephone polling plus online surveys:

“There’s a lot of people who say online research is just as good as telephone research. That has not been proven to be true and we have recent examples in Atlantic Canada where a competitor of ours has used an online methodology and have not got it within the margin of error they quoted,” he said.

“They are not even supposed to quote margin of error in online polls.”

Industry critics

Not all pollsters are as enthusiastic about the proliferation of polls and the increasingly close relationship between the media and opinion research firms.

In April, Allan Gregg – perhaps the country’s most famous researcher – and Frank Graves of Ekos spoke out in an article by Canadian Press.

There’s broad consensus among pollsters that proliferating political polls suffer from a combination of methodological problems, commercial pressures and an unhealthy relationship with the media.

Start with the methodological morass.

“The dirty little secret of the polling business . . . is that our ability to yield results accurately from samples that reflect the total population has probably never been worse in the 30 to 35 years that the discipline has been active in Canada,” says veteran pollster Allan Gregg, chairman of Harris-Decima which provides political polling for The Canadian Press.

The increased use of cell phones and changing lifestyles have made traditional telephone surveys less reliable, according to Gregg.  Online polling may produce more reliable results in some instances but not in others.

Still, according to Gregg, polling firms are producing margin of error calculations “as if we’re generating perfect samples and we are not anymore.” 

Pollsters continue to generate horse race polls for their marketing value, according to both Gregg and Andre Turcotte, a pollster and communications professor quoted in Joan Bryden’s Canadian Press story from April.

Turcotte says political polls for the media are “not research anymore” so much as marketing and promotional tools. Because they’re not paid, pollsters don’t put much care into the quality of the product, often throwing a couple of questions about party preference into the middle of an omnibus survey on other subjects which could taint results.

And there’s no way to hold pollsters accountable for producing shoddy results since, until there’s an actual election, there’s no way to gauge their accuracy.

Not surprisingly, the association representing polling firms disagrees.  The Market Research and Intelligence Association (MRIA) took out a full page ad in newspaper’s across Canada when the polling controversy first sprang up in February.  The ad affirmed the association’s “confidence in the results of our polling and the value that we provide to Canadians.”

Politics, polls and the media

The 2011 provincial general election in Newfoundland and Labrador brought with it both an unprecedented number of horse race polls and a certain level of controversy.

In the second part of this series – on Tuesday -  we’ll take a look at the polls, the polling firms, what they reported, and what the polls measured.

- srbp -

The Series:

Related:

15 October 2011

An excess of chutzpah: pollster attacks colleagues over methods, accuracy #nlpoli

Corporate Research Associates president Don Mills is criticising his professional colleagues for their use of online surveys to conduct opinion polling.

CRA uses telephone surveys. In two election polls released in September, MQO reportedly used a combination of telephone and online surveys to prepare it’s results. Environics used an online method and Telelink used telephone surveys.

According to the Telegram:

An in-depth poll by CRA conducted for The Telegram came closest to election night results, Mills said.

The Telegram noted:

CRA, using a telephone poll based on a sample size of 800, predicted 59.5 per cent support for the PCs among decided voters, 24.7 per cent for the NDP and 15.8 per cent for the Liberals.

The actual election results were 56.1 per cent for the PCs; 24.6 for the NDP; and 19.1 per cent for the Liberals — a total difference of 6.8 per cent from the poll prediction.

The only problem is that claim isn’t true.

Like all of the opinion polls released during the campaign, Mills and CRA polled eligible voters.  They did not report screening for voters only nor indicate any method by which they determined whether those opinions they surveyed related to people who would vote only.

By surveying all eligible voters, Mills and CRA should have reported all their responses, including those who indicated they would not vote or had no opinion.

That’s what the Telegram did in it’s front page story on Thursday.  The numbers cited in the Telegram on Saturday disregard some responses and therefore  present a distorted and misleading impression of what CRA’s polling found.

Here’s what the Telly reported compared to the actual reported vote result on Tuesday as a share of eligible vote:

Telegram
Sept 30 - Oct 3

Actual Vote Oct 11

CRA Apparent Error*


PC

44

32

+ 12

LIB

12

11

+ 1

NDP

18

14

+ 4

UND/Will not vote

26

42

- 16

Note:  The figures do not add to 100% everywhere due to an apparent minor rounding or typographical error in the results as reported by the Telegram.  SRBP adjusted the UND by one percentage point from what the Telegram reported.  When SRBP contacted the Telegram for more information on the poll, the newspaper management refused to discuss the results at all beyond what was in the published stories.

Even allowing for that one percentage point, the published CRA results are significantly different from the actual result.

SRBP compared most of the polls in a pre-election post.

Compared to CRA, MQO** was off by about the same proportions using its hybrid method. CRA was off by the same country mile in 2007.

Environics was closer to the final actual result than either of those two.

Of all surveys released during the campaign, Telelink came closest to the actual result, just as they did in 2007.

SRBP will have more on the polls in the recent general election in a series starting on Monday.

We’ll look at:

  • the polls themselves, what they reported and how they reported it,
  • compare the poll findings with the actual results,
  • tackle the comments by Liberal leader Kevin Aylward,
  • look at poll reporting standards in the news media and in the polling industry, and
  • and look at the way the local media used polls in the past two elections.

- srbp -

Related: 

  • Comparing polls”  By Horizon Research, a New Zealand opinion research firm that uses online polling.  Horizon questions the validity of discounting upwards of 30% or more of responses when reporting survey results.
  • Two wrongs and you get a news story”  discusses the way CRA’s reporting of decideds produces a misleading impression, in this case from 2009, of an increase in support for one party when it actually declined.
  • CRA has been known to engage in controversial practices, like releasing a poll just before a by-election vote, significantly ahead of its usual schedule for releasing its omnibus for that quarter.

*  Apparent error refers to the discrepancy between the CRA poll result reported by the Telegram on the front page of its Thursday edition compared to the actual vote result. 

All polls contain error. Researchers strive to reduce known and possible sources of error. 

** Edit to correct the comparison.

02 October 2011

CBC torques poll coverage #nlpoli #nlvotes

Think of it as another form of poll goosing.

As an example of how news media can take a piece of information and make a false statement out it, consider CBC’s online version of the story about a poll released Friday by the same company that polls for the provincial government’s energy corporation.

“Liberal support in free fall” screams the headline.

The first sentence is less dramatic:

A public opinion poll released Friday suggests that Newfoundland and Labrador's Liberals have lost even more ground leading into the last half of the Oct. 11 election campaign.

There’s even a graphic that uses the numbers from the news release.  They show a drop of five percentage points in decided Liberal support, according to the poll.

The only problem for CBC is that the headline and the lede are false.

The combined margin of error for this poll and the one before it is more than the five point drop shown in the report numbers in the two polls..  Therefore, the actual numbers for the Liberals fall within a range of 4.5 or 5 points above or below the figures given.

This is why polls with such large margins of error tend to be useless for most meaningful purposes.  And for detecting trends, you’d have to see a huge drop between polls – like more than 10 points -  in order to get something that could conceivably be called a significant change.

What would free fall look like? 

Well, certainly a hell of a lot more than what is shown.  10 points or more would be a likely candidate for such dramatic language, especially over the course of a mere 10 days or so.

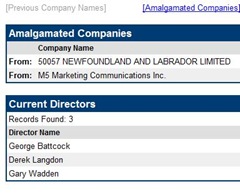
m5It’s also interesting that while CBC mentioned a relationship between MQO and advertising company M5, they didn’t mention that MQO is also Nalcor’s pollster because it is owned by M5. The advertising company is Nalcor’s agency of record.

mqCBC also said MQO was “affiliated” with M5.  That’s not even close to correct either. 

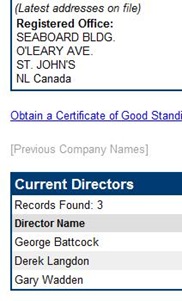
According to the provincial registry of companies, the same three men are the only directors of M5 (above), MQO (right)and all the companies within the M5 Group.

MQO is owned by M5. 

That’s factually correct.

“Affiliated”? 

That would be misleading bordering on deceptive.

- srbp -

Related: